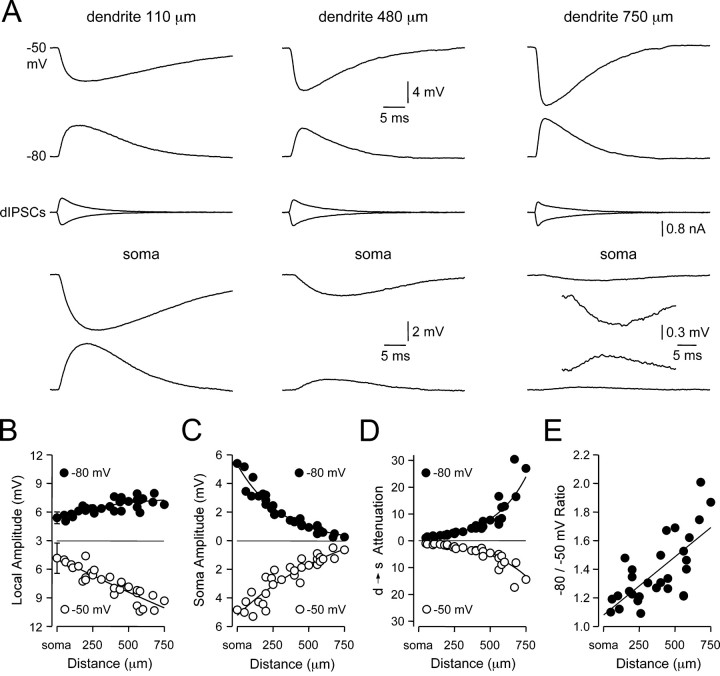
Figure 1.
Site- and voltage-dependent control of dIPSP amplitude. A, Simultaneous recording of local dendritic (top traces) and somatic (bottom traces) dIPSPs generated at the indicated sites from dendritic membrane potentials of -50 and -80 mV. The middle traces show the injected IPSC. The inset shows the somatic recording of dIPSPs generated at 750 μm from the soma at higher magnification. B, C, Pooled data demonstrating the site and voltage dependence of local (B) and somatic (C) dIPSP amplitude. Somatic points represent mean ± SD (n = 5). Note the site-dependent increase in the local amplitude of IPSPs generated from membrane potentials of -50 mV (○). D, Pooled data describing the voltage dependence of the dendro-somatic attenuation of dIPSPs. E, Ratio of the dendro-somatic attenuation of dIPSPs generated from membrane potentials of -50 and -80 mV. Note the 1.7-fold increase in the dendro-somatic attenuation of dIPSPs generated from hyperpolarized membrane potentials. Data were fit with single exponential relationship [B (-80 mV), C, D] or a linear regression [B (-50 mV), E].

