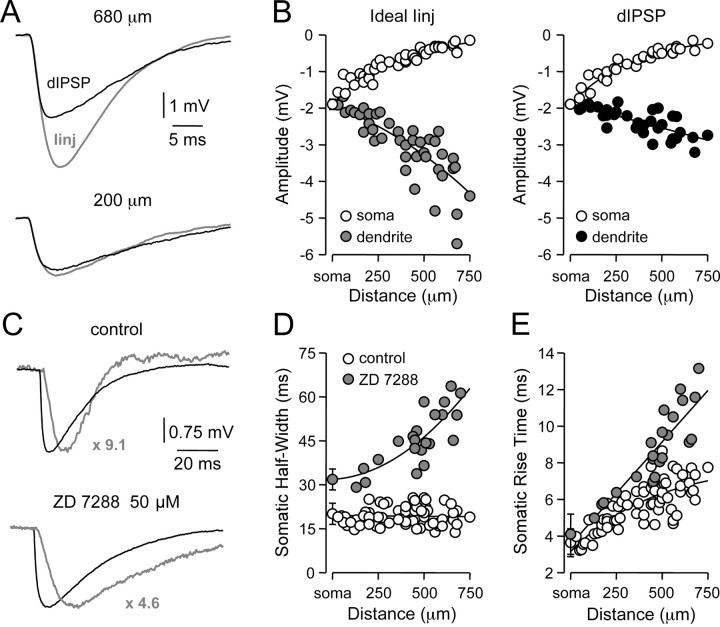
Figure 4.
Properties of IPSPs simulated as ideal current sources. A, Dendritic recordings of artificial (gray) and dIPSPs generated at the indicated sites, by IPSC-shaped ideal current sources or conductance changes, respectively, from a membrane potential of -60 mV. B, Pooled analysis of the site-dependent increase in local (
 /•) and decrease in somatic (○) amplitude of IPSPs generated with an ideal current source (left) or conductance source (right). C, Comparison of the somatic kinetics after peak scaling of artificial IPSPs generated at dendritic (gray; 680 μm) and somatic sites under control and after IH channel blockade with ZD 7288. The gray figures indicate the dendro-somatic attenuation of dendritic IPSPs. D, Relationship between somatic IPSP time course (half-width) of artificial IPSPs generated under control (○) and after IH channel blockade (
 ). Lines represent a linear regression (control) and a single exponential (ZD 7288). E, Pooled data showing the site dependence of the somatic rise time (10-90%) of artificial IPSPs under control (○) and following IH channel blockade (
 ). Lines represent a single exponential (control) and a linear regression (ZD 7288). Somatic points in B, D, and E represent mean ± SD.

