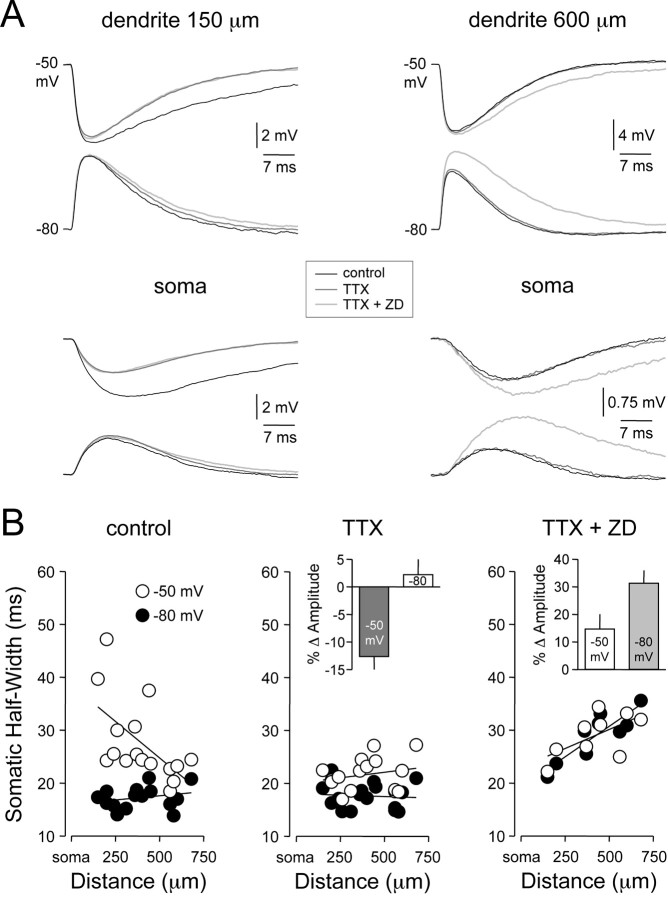
Figure 5.
Dendritic IH and axo-somatic INAP shape IPSP time course. A, Simultaneous dendritic (top traces) and somatic (bottom traces) recording of dIPSPs generated from dendritic membrane potentials of -50 and -80 mV at proximal (150 μm) and distal (600 μm) dendritic sites under control (black), after the blockade of sodium channels with TTX (1 μm; dark gray) and the coblockade of sodium and IH channels with TTX and ZD 7288 (50 μm; light gray). B, Site dependence of the somatic time course (half-width) of dendritic dIPSPs generated from -50 (○) and -80 mV (•) under the three experimental conditions. Note the coblockade of sodium and IH channels abolishes the voltage dependence of the somatic time course of dIPSPs. The insets show pooled analysis of percentage changes in the somatic amplitude of dIPSPs at -50 and -80 mV after the application of TTX (middle; relative to control) and the coapplication of TTX and ZD 7288 (right; relative to TTX alone).

