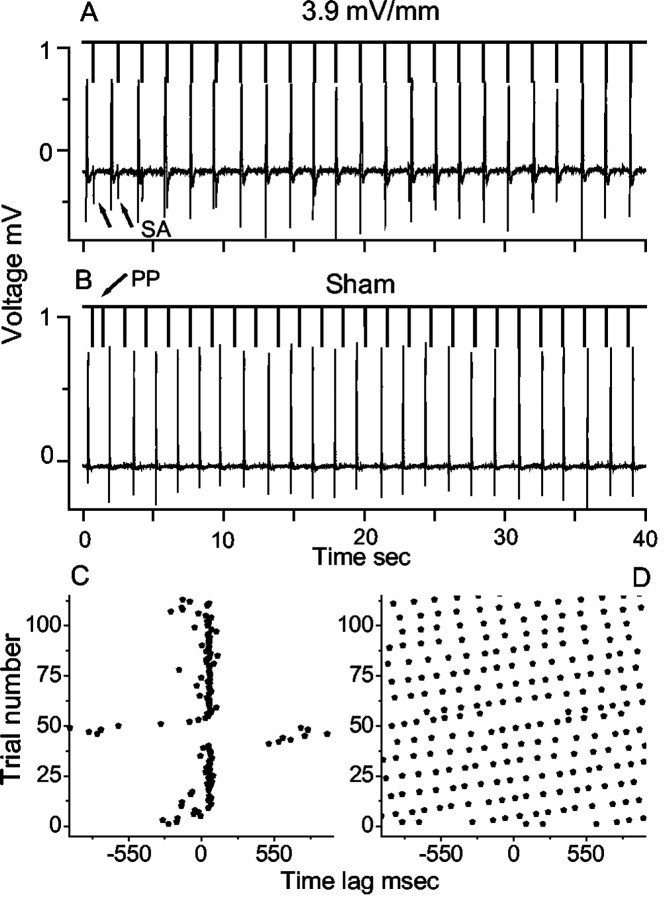
Figure 2.
Data taken from a CA3 experiment. The thick lines pointing downward in A and B indicate the times of the input stimuli (shown in Fig. 1 F). The thin traces are voltage recordings of population burst activity from CA3. A, Data from an experiment with an rms peak electric field strength of 3.9 mV/mm. B, Data from the corresponding sham experiment. Stimulus artifact (SA) and phase perturbations (PP) are marked. C, D, Raster plots from experiments in A and B showing entrainment and lack of entrainment, respectively.

