
Figure 3.
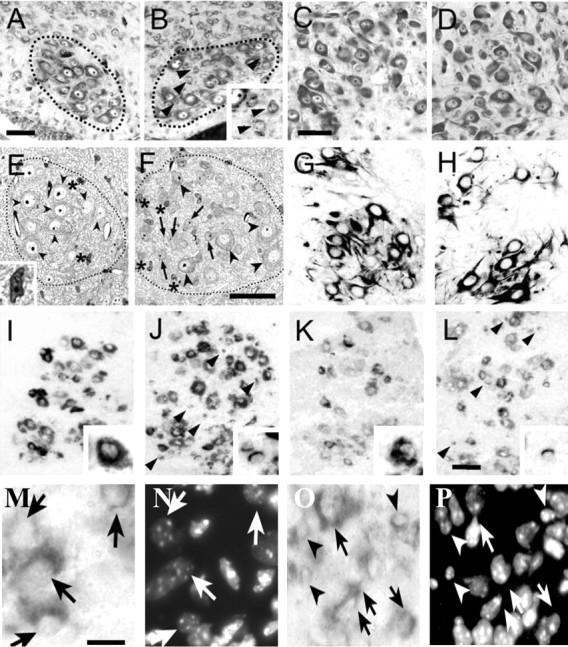
A, B, Nissl-stained lumbar MNs of P0 WT (A) and Bax KO (B) mice (motor column enclosed by dotted lines). Arrowheads in B indicate small neurons within ventral horn motor column (see also inset). Scale bar: A (for A, B), 50 μm. C, D, Nissl-stained facial MNs of P10 WT (C) and Bax KO (D) mice. Scale bar: C (for C, D), 50 μm. E, F, Plastic-embedded (1 μm) sections of lumbar MNs in the ventral horn of P2 WT (E) and Bax KO (F) mice. Arrows indicate small atrophied MNs, arrowheads indicate normal MNs, and asterisks indicate glial cells (inset in E is an enlargement of a glial cell). Aberrantly small neurons were also evident in the adult spinal cord ventral horn of Bax KO (data not shown). Scale bar: F (for E, F), 50 μm. G, H, SMI-32 immunoreactivity in P0 lumbar spinal cord VH of WT (G) and Bax KO (H) mice. I-L, Localization of c-ret (I, J) and GFRα1 (K, L) mRNAs in P2 WT (I, K) and Bax KO (J, L) mice. Scale bar: L (for G-L), 50 μm. Arrowheads in J and L indicate c-ret + atrophic MNs. Insets in I-L are higher magnifications of c-ret+ and GFRα1 + normal and atrophic MNs. M-P, Higher magnification images of c-ret-immunolabeled MNs in the ventral horn of WT (M) and Bax KO (O) together with Hoechst labeling of MN nuclei in the same sections (N, P). Scale bar: M (for M-P), 15 μm. Arrows indicate normal large MNs, and small atrophic MNs are indicated by arrowheads.