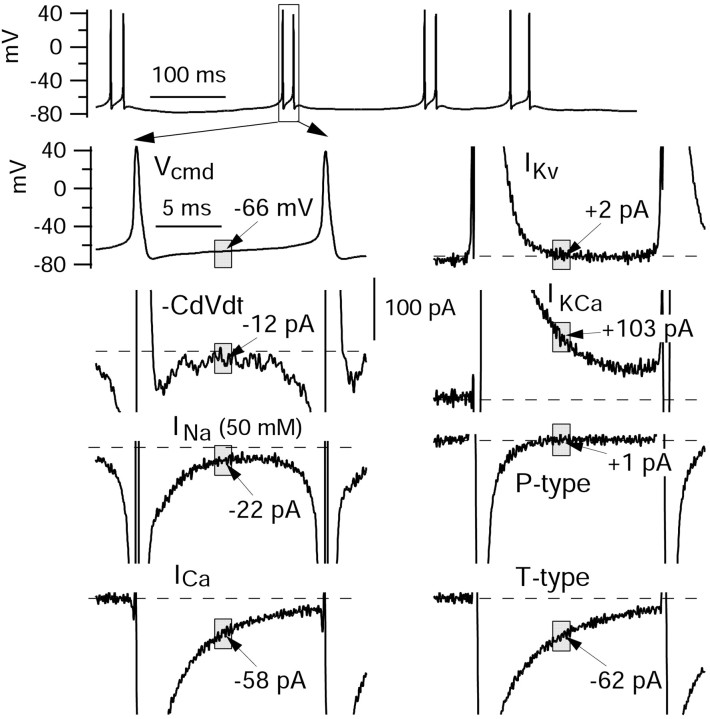
Figure 10.
Ionic currents flowing during the interspike intervals in spontaneous bursts. Indicated values are averaged over a 1.4 msec window (gray box) starting 4.8 msec after the post-spike trough. All currents, including P-type and T-type calcium currents, were recorded in a single cell. Sodium currents are as recorded in reduced NaCl.

