
Figure 7.
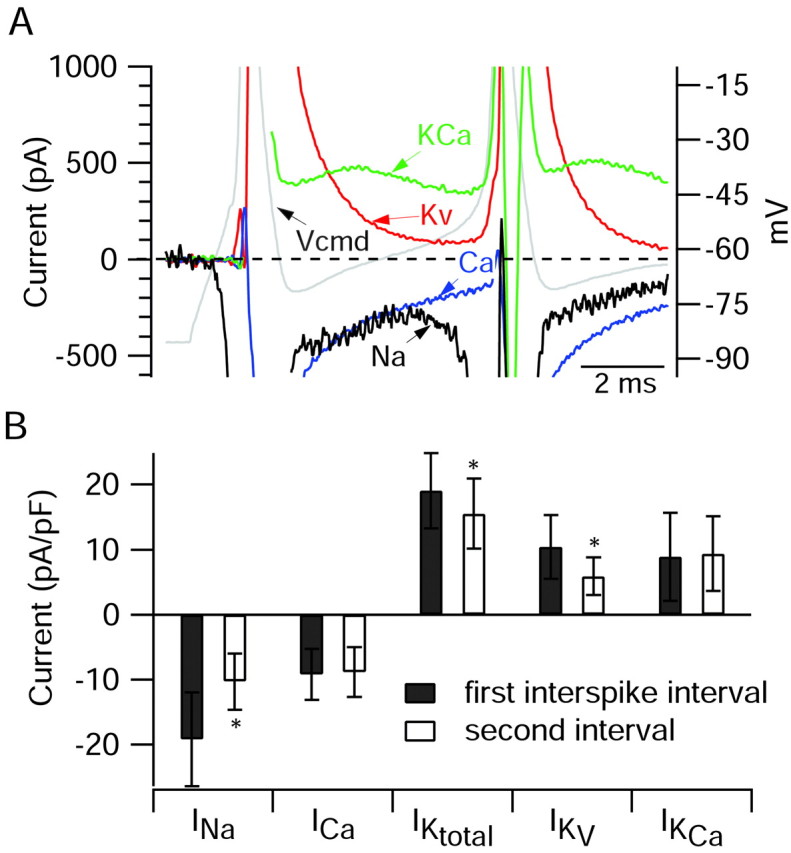
A, Ionic currents during the first interspike interval on an expanded current scale to show the differing time course of the various currents during the interspike interval. Same cell as in Figures 5 and 6. Gray represents voltage during burst waveform (right-hand y-axis). Black represents sodium current. Blue represents calcium current. Red represents purely voltage-activated potassium current. Green represents calcium-activated potassium current. B, Collected results for magnitude of the various ionic currents during the first and second interspike intervals measured as in Figure 6, averaged over a 1 msec window starting 1.5 msec after the trough and normalized to the capacitance of the cell. Bars show mean ± SD. *p < 0.001; paired t test. The data for sodium and calcium currents are from 10 Purkinje neurons, and the data from potassium currents are from 8 of the same neurons in which a full set of solution exchanges was possible.