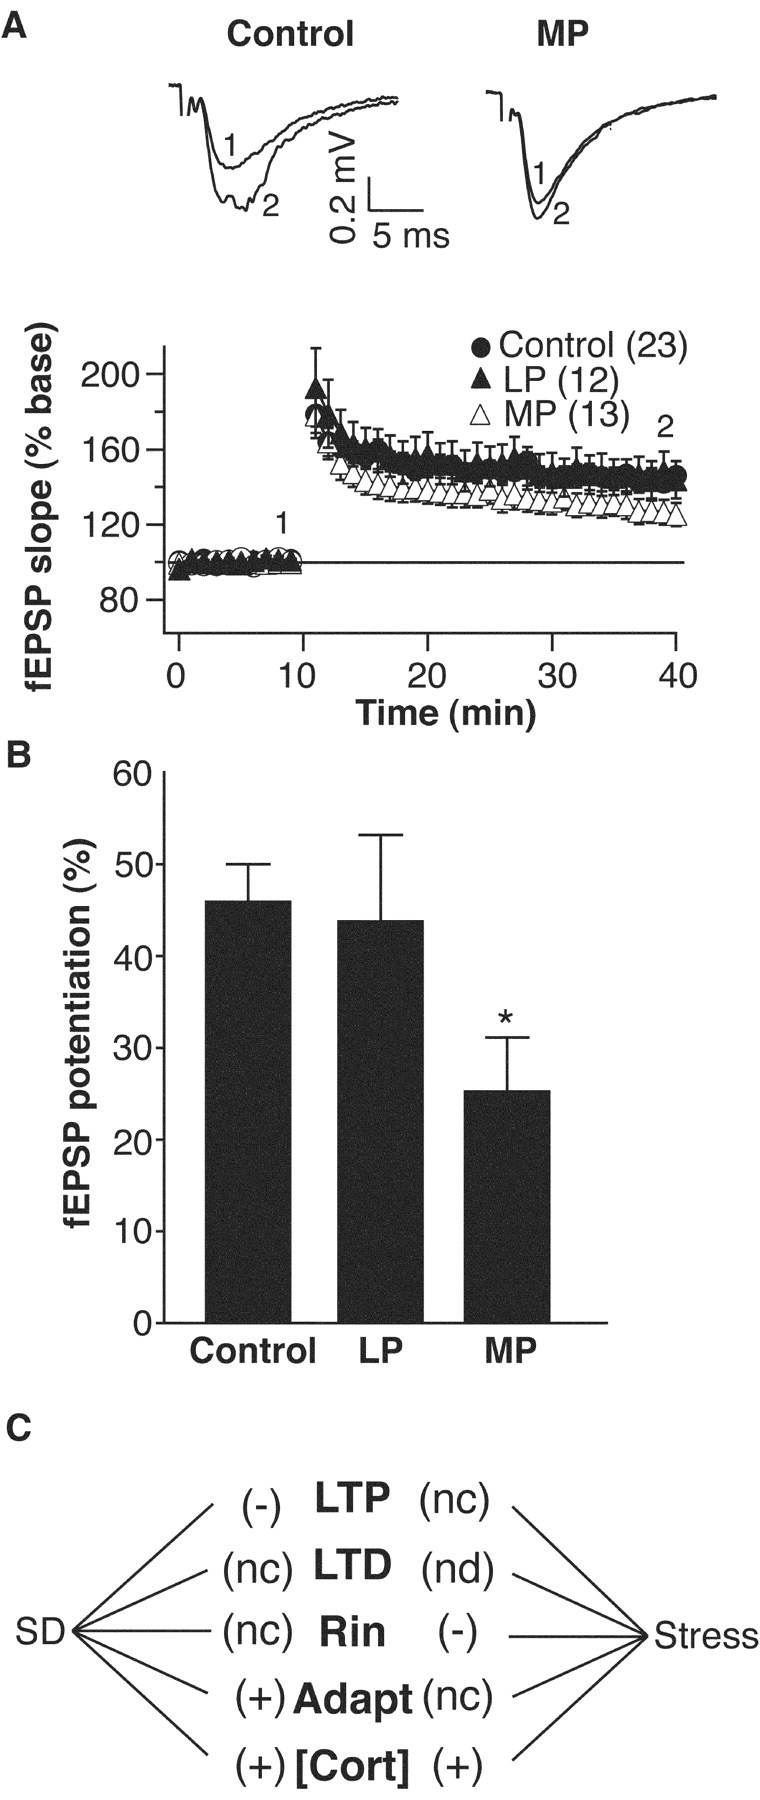
Figure 6.

A, Top, Representative CA1 field potentials recorded in vitro from control and multiple platform sleep-deprived rats after Schaffer collateral stimulation. Bottom, Grouped data showing normalized field EPSP slope from control, MP, and LP groups. LTP induction (2 × 100 Hz × 1 sec; 30 sec interval) occurred at the 10 min time point. B, Summary of EPSP slope LTP (mean ± SEM) for control, MP, and LP groups. We calculated potentiation by dividing the average EPSP slope at 30 min after tetanus by the average baseline EPSP slope. *p < 0.05, compared with control group. In all plots the number of cells in each group is given in parentheses. C, Summary sketch showing the differential effects of sleep deprivation versus stress on various synaptic and membrane properties of CA1 hippocampal cells. nd, Not determined; nc, not changed; Rin, input resistance.
