
Figure 2.
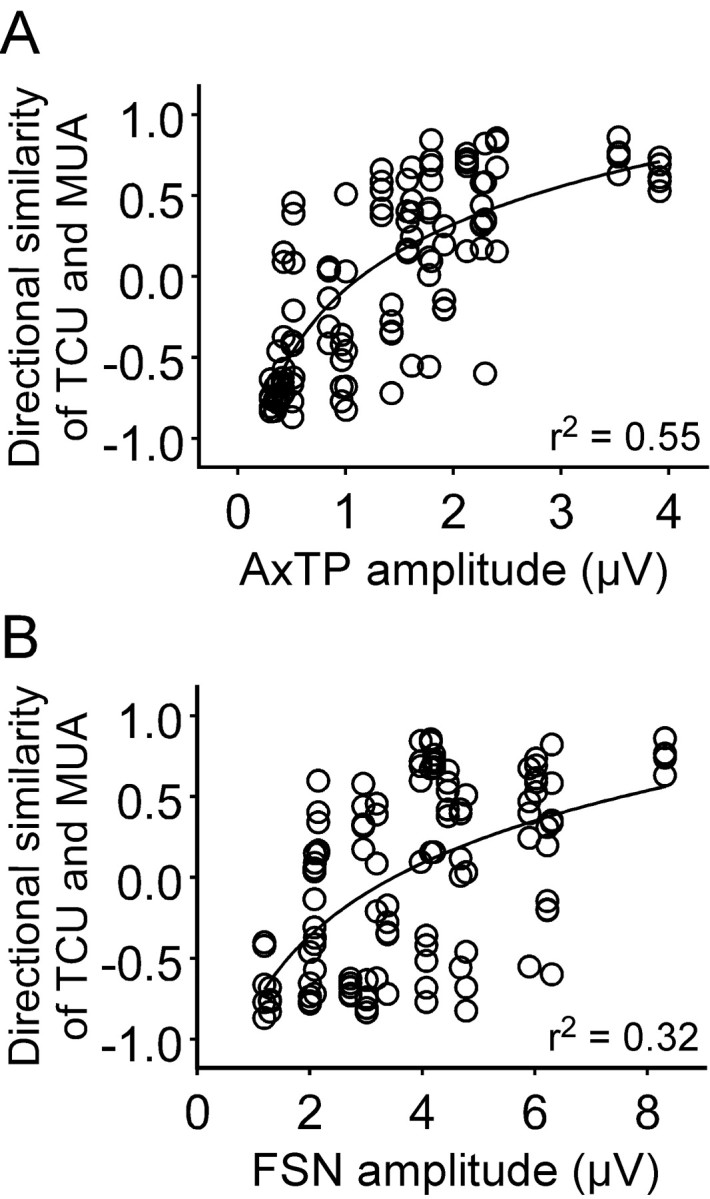
TC contributions to angular tuning domains. A, The SI comparing the polar plot of individual TC neurons to the polar plot of multi-unit activity recorded at a cortical site is proportional to the amplitude of the AxTP produced by the TC neuron at that location in the barrel. Line, Fit of logarithmic (base 10) regression (r2 = 0.55; p < 0.0001). B, Same analysis as in A, but for the FSN (r2 = 0.32; p < 0.0001).