Figure 3.
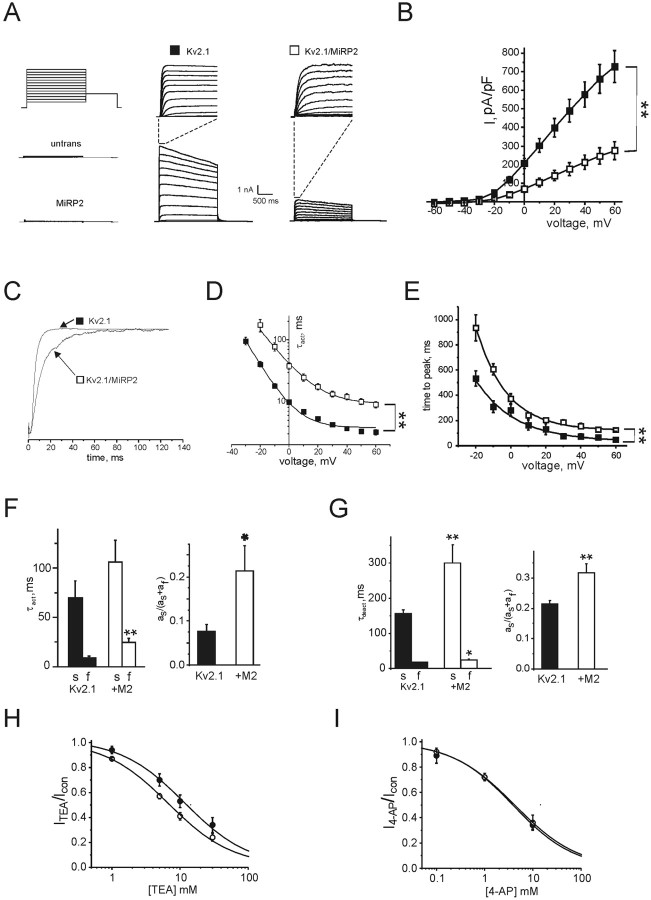
MiRP2 slows and downregulates Kv2.1 currents. A, Exemplar traces showing currents recorded using protocol 1 (inset) in nontransfected CHO cells (untrans) or CHO cells cotransfected with GFP and either MiRP2, Kv2.1 (filled square), or MiRP2 plus Kv2.1 (open square), as indicated. Top center and top right traces, expanded view of first 150 msec of Kv2.1 and MiRP2-Kv2.1 traces, as indicated by dashed lines. B,Mean peak current density for CHO cells expressing Kv2.1 alone (filled squares; n = 19) or MiRP2 and Kv2.1 (open squares; n = 10); protocol as in A. Error bars indicate SEM. The double asterisk indicates significant difference between current densities at all voltages between -20 and +60 mV (unpaired t test;p<0.01). C, Current density-normalized early portion of exemplar Kv2.1 and MiRP2-Kv2.1 traces at 0 mV illustrating slowing of Kv2.1 activation by MiRP2. D, Activation rates of Kv2.1 and MiRP2-Kv2.1 currents at different voltages as in B, fitted with a single exponential function, expressed as τact. Error bars indicate SEM. The double asterisk indicates significant difference between τact at all voltages between -20 and +60 mV (unpaired t test, p < 0.01). E, Time to peak current of Kv2.1 and MiRP2-Kv2.1 currents as in B. Error bars indicate SEM. The double asterisk indicates significant difference between times to reach peak at all voltages between -20 and +60 mV (unpaired t test; p < 0.01). F, Mean activation rates of Kv2.1 and MiRP2-Kv2.1 currents at 0 mV as in B, fitted with a double exponential function, error bars indicate SEM. Left, Mean slow and fast τact components; the double asterisk indicates significant difference between the fast components of τact (unpaired t test; p < 0.01). Right, Mean relative amplitudes of the slow component of τact; the single asterisk indicates significant difference (unpaired t test; p < 0.05). G, Mean deactivation rates of Kv2.1 and MiRP2-Kv2.1 currents at -30 mV as in B, fitted with a double exponential function; error bars indicate SEM. Left, Mean slow and fast τdeact components; the single and double asterisks indicate significant differences between the corresponding components of τdeact depending on the presence of MiRP2 (unpaired t tests; p < 0.05 and p < 0.01, respectively). Right, Mean relative amplitudes of the slow component of τdeact; the double asterisk indicates significant difference (unpaired t test; p < 0.01). H, TEA block of Kv2.1 (solid) versus MiRP2-Kv2.1 (open) currents evaluated using protocol 3 (inset) in the absence and presence of 0-30 mm TEA bath and peak currents recorded at equilibrium. Dose-response curves were fit with a logistic dose-response function: y = A2 + (A1-A2 /1 + (x/x0)p); for Kv2.1 x0 = 11.7 ± 2.7 mm, p = 0.92 ± 0.19; for MiRP2-Kv2.1 x0 = 6.7 ± 0.79 mm, p = 0.92 ± 0.08; n = 5 cells per point. I, 4-AP block of Kv2.1 (solid) versus MiRP2-Kv2.1 (open) currents evaluated using protocol 3 (inset) in the absence and presence of 0-10 mm 4-AP and peak currents recorded at equilibrium. Dose-response curves were fit with a logistic dose-response function: y = A2 + (A1-A2/1 + (x/x0)p); for Kv2.1 x0 = 3.9 ± 0.79 mm, p = 0.68 ± 0.09; for MiRP2-Kv2.1 x0 = 4.2 ± 1.4 mm, p = 0.66 ± 0.14; n = 5 cells per point.

