Figure 5.
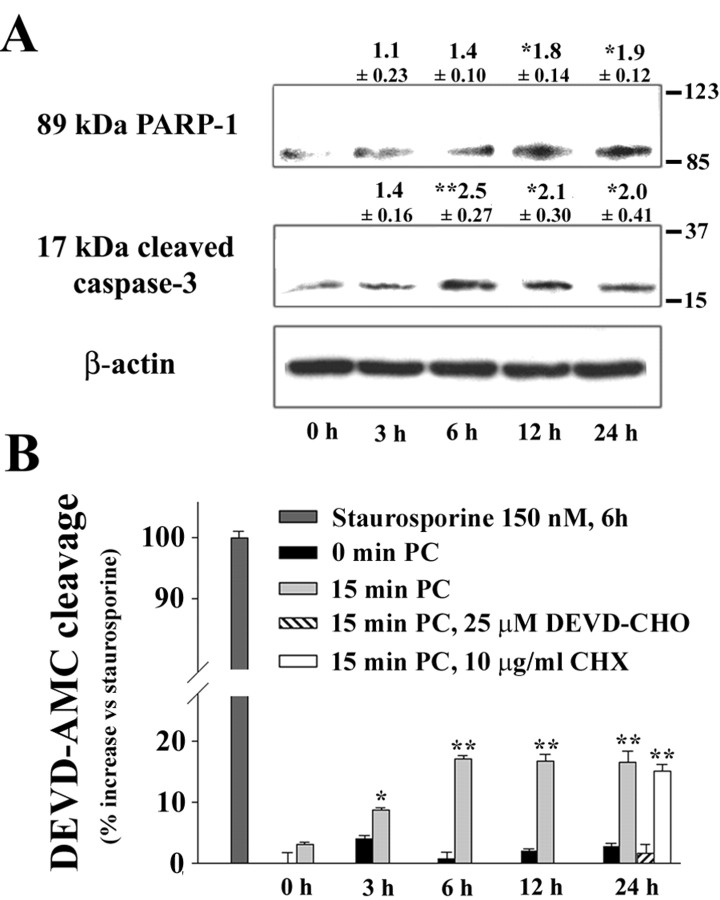
Time course of caspase-3 activation and PARP-1 cleavage after preconditioning. A, Western blots with antibody to the cleaved (activated) 17 kDa caspase-3 fragment or the 89 kDa (inactivated) PARP-1 fragment were prepared from cultures 0-24 hr after a sham or 15 min ischemic preconditioning. Values above the bands denote the fold increase ± SE, relative to the 0 hr time point (*p < 0.05; **p < 0.01; n = 3-4). B, Caspase-3 enzymatic activity was measured in cultures lysed at sequential time points after sham washes only (0 min PC) or 15 min of ischemic preconditioning (15 min PC). PC produced a significant increase in caspase-3 within 3 hr of PC. The increase was blocked in cultures treated with the caspase inhibitor DEVD-CHO after PC, but not in cultures treated with CHX. Staurosporine (150 nm) was used as a positive control. Fluorescence values are expressed as increase over control, normalized to the increase induced by staurosporine. *p < 0.05; **p < 0.01; representative of three independent experiments each with n = 3-4.

