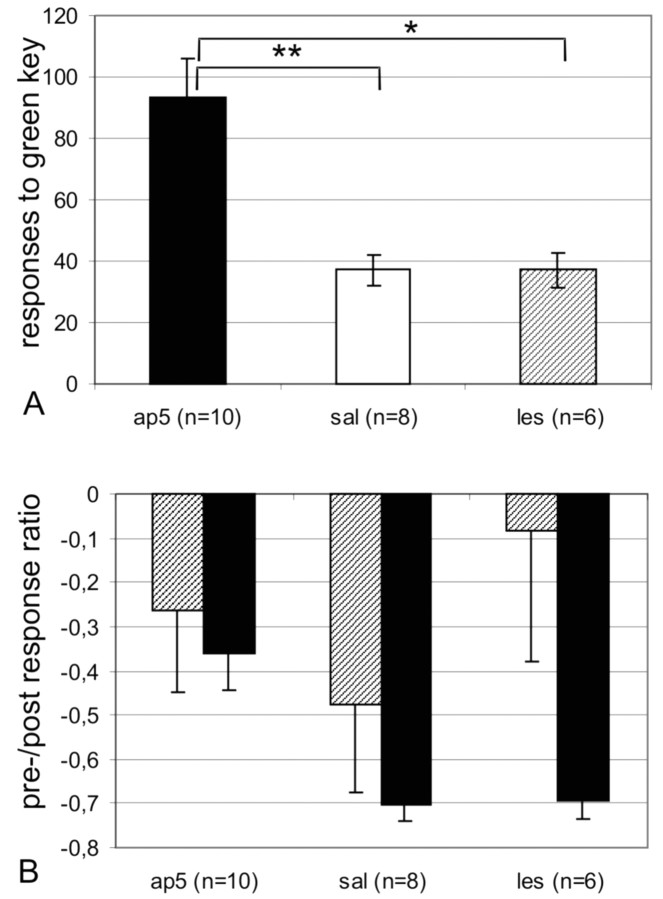
Figure 2.
Responses during extinction. A, Mean ± SEM responses to the green key during the extinction session made by AP-5-treated (solid columns), lesioned (hatched columns), and vehicle-treated (open columns) pigeons. B, Means ± SEM values for the pre/post response ratio to the green (solid bars) and red (hatched bars) keys, respectively.

