
Figure 10.
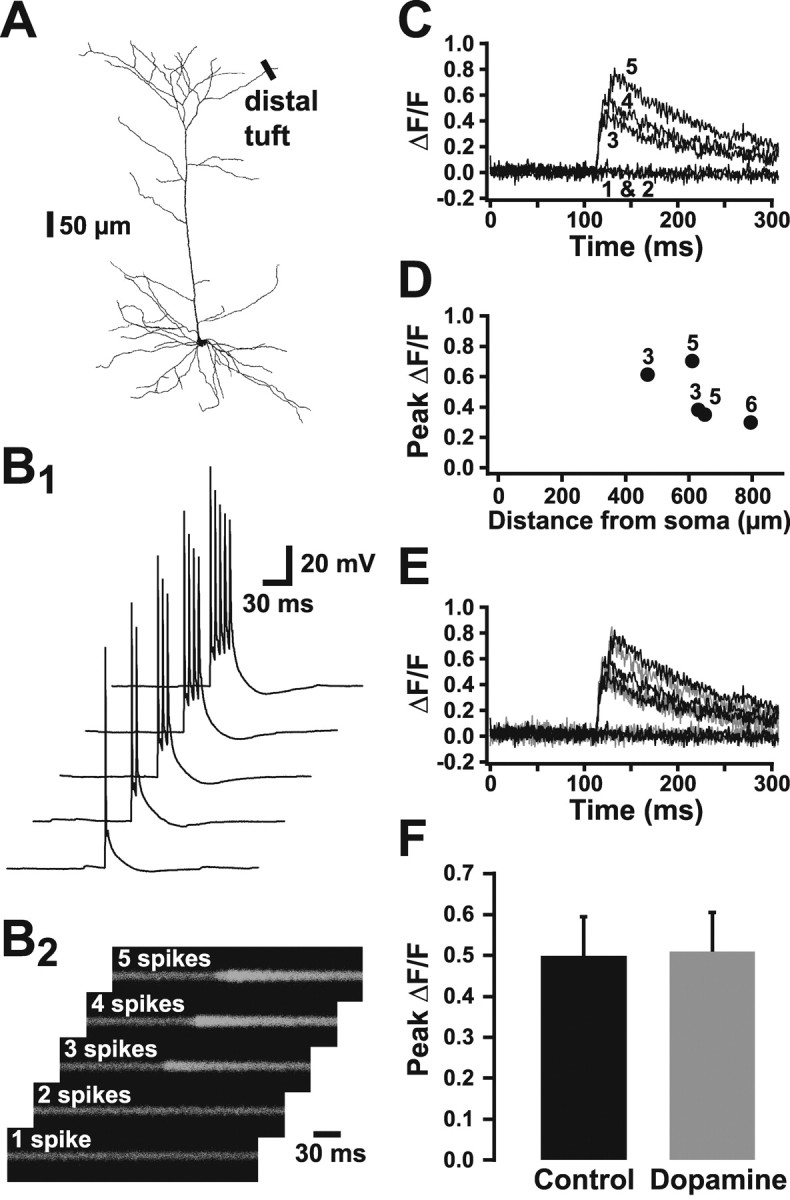
AP backpropagation into the distal tuft is frequency dependent. A, Reconstructed prefrontal layer 5 pyramidal neuron showing location of line scans in the distal apical tuft (470-780 μm from the soma). B, One to five APs at 200 Hz were generated by brief somatic current injections (B1), whereas simultaneous line scans taken across dendrites in the distal apical tuft produce the corresponding calcium transients (B2). C, Plots of average ΔF/F for five trials similar to that shown in B. Numbers refer to somatic APs generated per trial. Note that a detectable calcium signal is only observed during bursts of three or more APs. D, Plot of peak ΔF/F during high-frequency AP bursts as a function of distance from the soma. The numbers indicate the minimum number of APs needed to evoke a detectable calcium signal at each location. E, Plot of average ΔF/F during AP bursts of three to six APs (200 Hz) under control conditions (black) and during bath application of 10 μm dopamine (gray). F, Summary of peak ΔF/F in control and dopamine (10 μm; n = 4) conditions at distal tuft locations during high-frequency AP bursts. The minimum number of APs needed to evoke a detectable calcium signal under control conditions was used for comparison of control and dopamine responses.