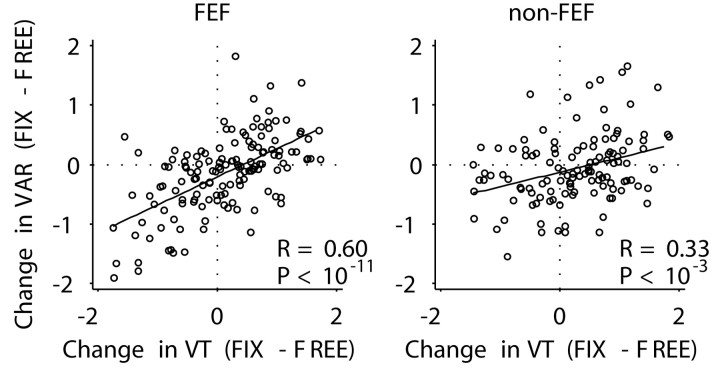
Figure 10.
Relationship between tuning vector amplitude (relative change in amplitude between fix and free trials) and FR variance (relative change in variance between fix and free trials). The regression lines had similar slope for FEF (0.47) and non-FEF (0.24) recordings. Solid line, Linear regression; R, correlation coefficient; P, significance level of correlation (t test).

