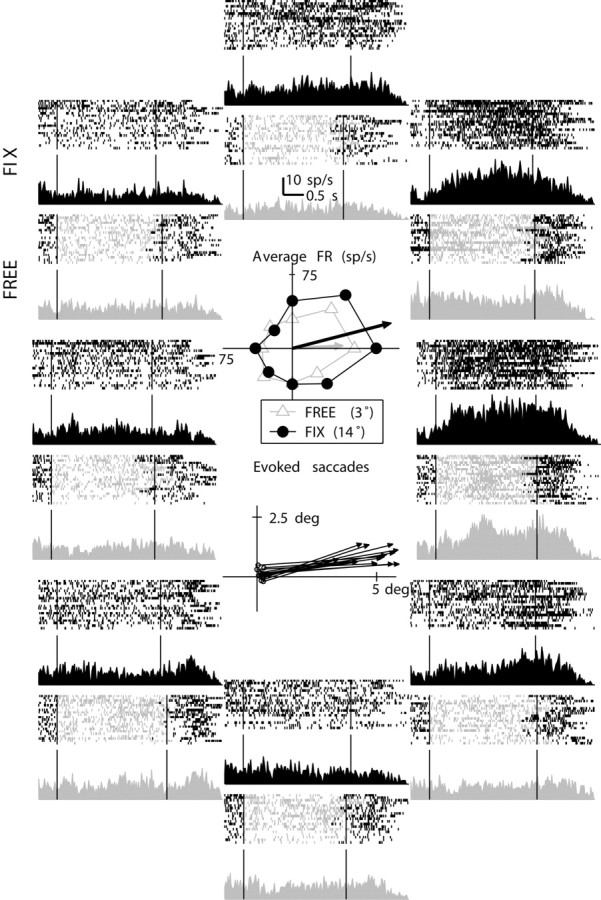
Figure 4.

Example FEF neuron. The outer subplots represent the neural activity for different target directions (fix, dark gray, upper half of the subplot; free, light gray, lower half of the subplot) with spike rasters the associated PSTHs. The upper central subplot represents the average FR and tuning vector for the variable delay interval for fix (dark gray filled circles) and free (light gray triangles) trials. The lower central subplot represents the electrically evoked saccade (stimulation threshold, 40 μA; average saccade amplitude, 4.8° and angle 9°).
