
Figure 7.
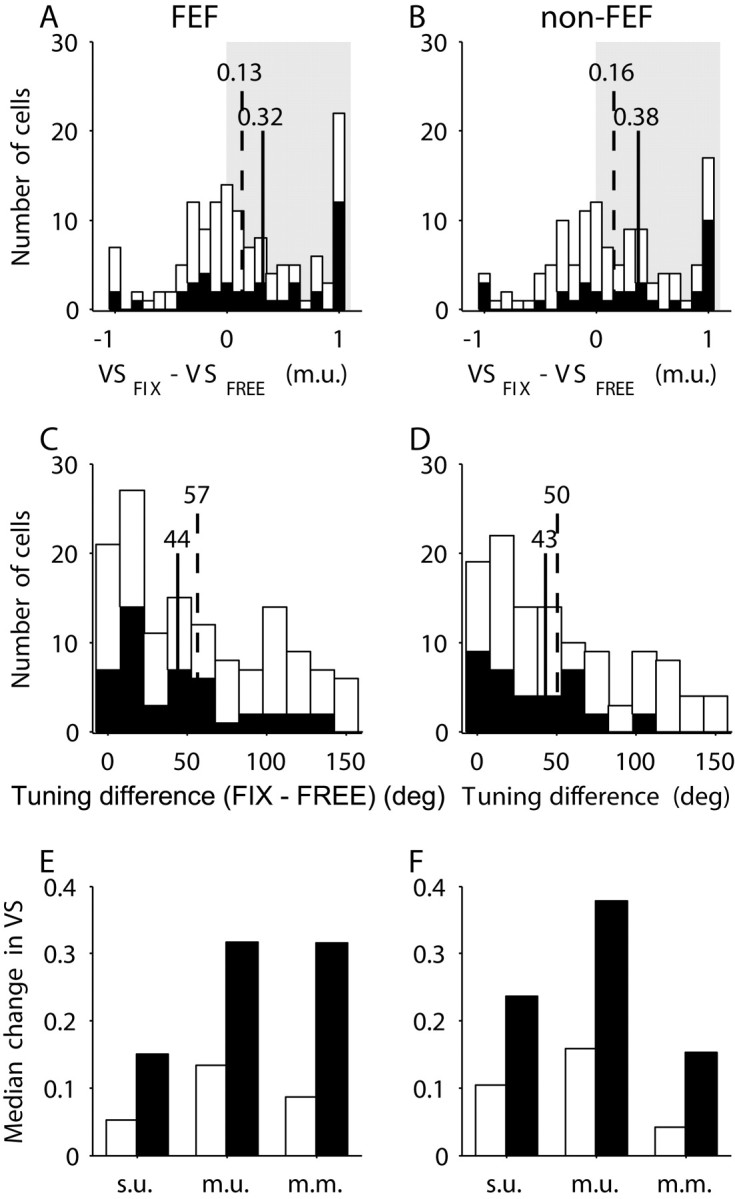
Changes in VS and changes in the direction of tuning. A, B, The distribution of the changes in VS (m.u.) for FEF (A) and non-FEF (B). C, D, The difference in tuning between fix and free trials for FEF (C) and non-FEF (D). Shown are the results for the global set of all recorded cells (white bars) and for the subset of the significantly tuned cells (black bars). For A-D subplots, the vertical lines represent the median values for the global set of cells (dotted line) and for the significantly tuned cells (solid line). E, F, The median values for the change in VS for different representations and for FEF (E) and non-FEF (F).