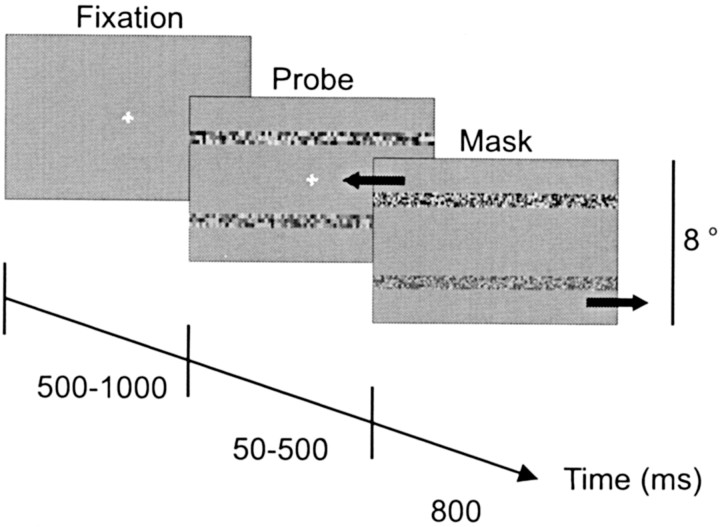
Figure 1.
Schematic diagram of one trial. The sequence of the three screen images depicts the three intervals that occurred over the course of a trial. Each screen image represents the central portion (11.7° hor × 8° ver) of the video monitor. The large black arrows in the mask interval signify the opposed horizontal motion of the masks and did not appear on the monitor.

