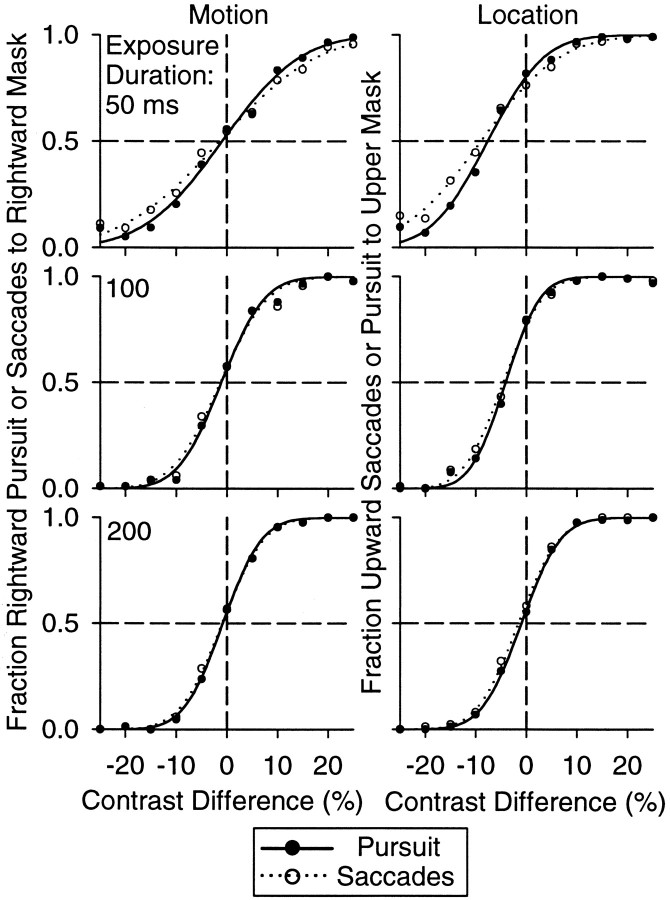
Figure 4.
Oculometric functions for pursuit and saccades for three exposure durations. The left column shows oculometric functions from the motion set of measurements. Each data point represents the fraction of rightward pursuit (filled symbols) and saccades to the rightward mask (unfilled symbols) plotted as a function of probe contrast difference. The right column shows oculometric functions from the location set of measurements, in which each data point represents the fraction of pursuit choices to the upper mask (filled symbols) and the fraction of upward saccade choices (unfilled symbols) plotted as a function of probe contrast difference. The smooth functions are cumulative normal fits to the data. Each row of graphs shows data from one exposure duration.

