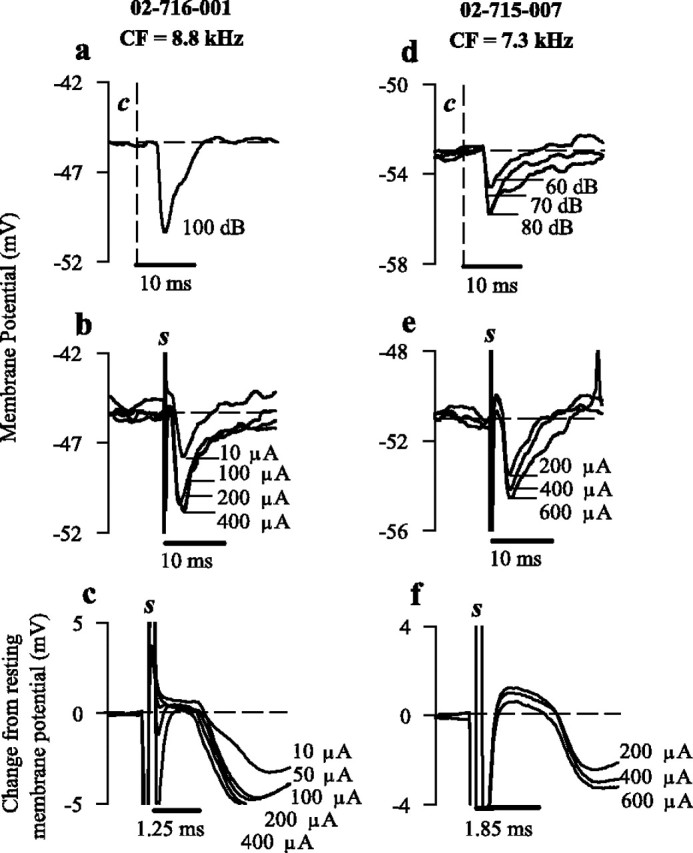
Figure 3.

Inhibition through acoustic and electrical stimulation. a, IPSP produced in CT neuron 02-716-001 after a 100 dB SPL contralateral click (dashed vertical line denoted c). Horizontal dashed line indicates resting membrane potential. b, IPSPs resulting from electrical stimulation (stimulus artifact denoted s) of the contralateral CN (10, 100, 200, and 400 μA). c, Expanded time base of responses shown in b, with membrane potential standardized to zero demonstrating the synchronization of IPSP onset latency across varying stimulus strengths. d, Change in hyperpolarization amplitude in response to changing strength of contralateral acoustic click (60, 70, and 80 dB), represented in averaged intracellular traces from CS neuron 02-715-007. e, Average intracellular responses to increasing levels of contralateral electrical stimulation (200, 400, and 600 μA). f, Expanded time base of responses shown in e, standardized as in c.
