
Figure 4.
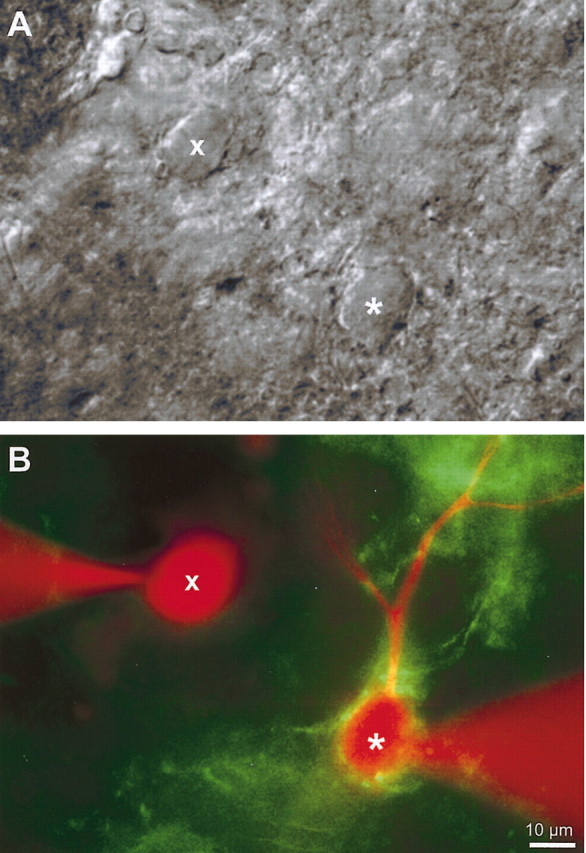
Matched intracellular recordings from FTNs and neighboring neurons. Differential interference contrast images (A) and fluorescent images (B) of an FTN (*) identified by GFP terminal clustering and a neighboring neuron (x) that was not surrounded by GFP-positive terminals and was, therefore, a presumed non-FTN. Neurons were recorded sequentially and each labeled intracellularly with rhodamine dextran.