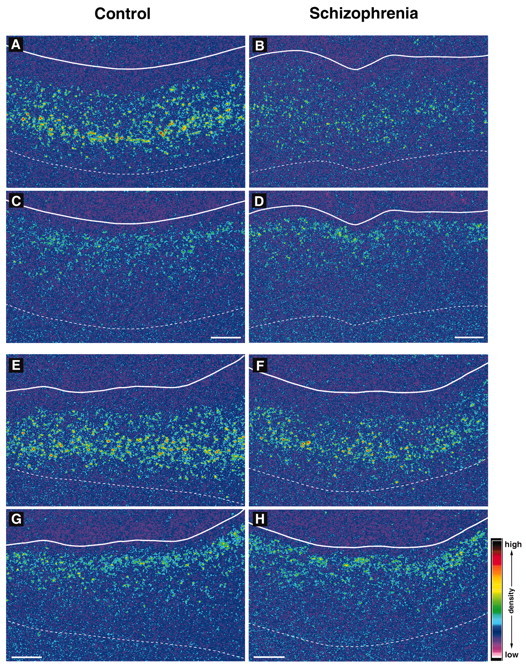
Figure 4.

Representative film autoradiograms showing signals for PV and CR mRNAs in PFC area 9 of subject pairs 3 (A–D) and 5 (E–H). The densities of hybridization signals are presented in pseudocolor manner according to the scale in bottom right. In both pairs, the PV mRNA signals appear to be weaker in subjects with schizophrenia (B, F) than in matched controls (A, E), whereas in the same region of the adjacent sections, CR mRNA signals do not appear to differ between subjects with schizophrenia (D, H) and matched controls (C, G). Solid and broken white lines indicate the pial surface and the border between white matter and gray matter, respectively. Scale bars: (apply to both sections from a given subject), 1 mm.
