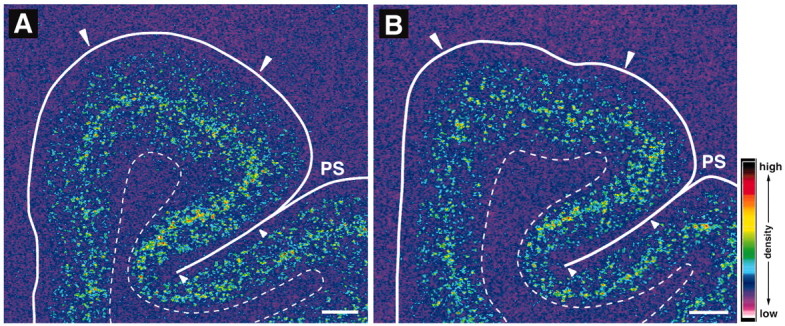
Figure 9.

Representative autoradiograms showing signals for PV mRNA in the PFC of control (A) and haloperidol-treated (B) monkeys. The densities of hybridization signals are presented in pseudocolor manner according to the scale in bottom right. Note that the signal distribution and intensity appear to be unchanged in the PFC of the haloperidol-treated monkey. Solid and broken white lines indicate the pial surface and the border between gray and white matter, respectively. PS, Principal sulcus. Pairs of large and small white arrowheads indicate the quantified regions in areas 9 and 46, respectively. Scale bars, 1 mm.
