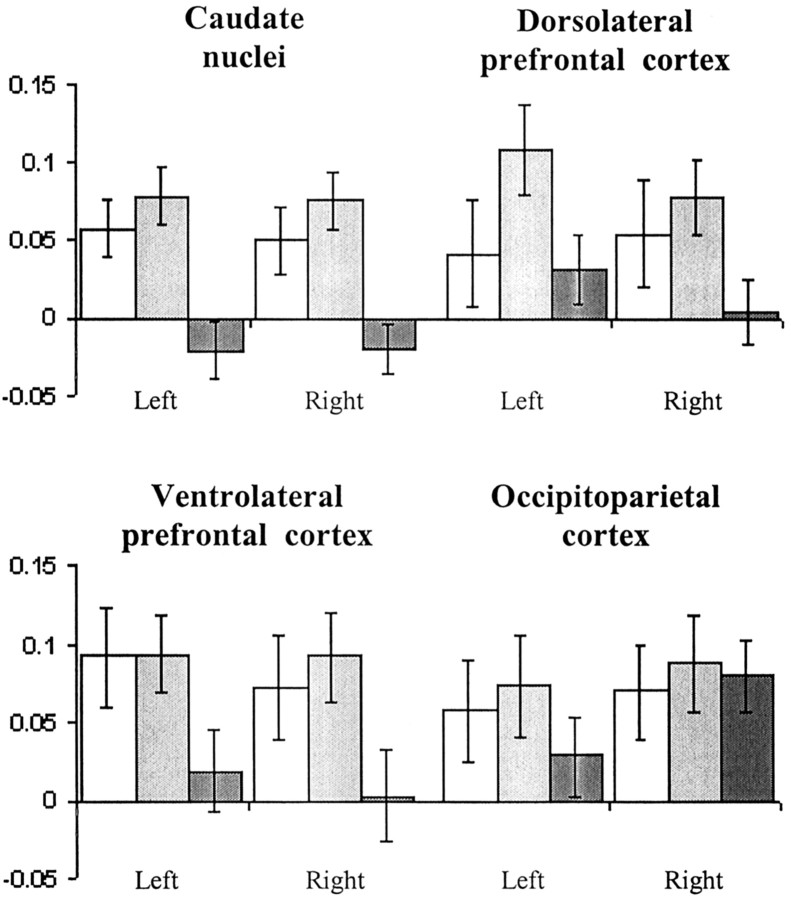
Figure 3.
Regional mean fMRI signal during manipulation. The subgroup of patients with executive impairments (▪) demonstrated significant underactivation (p < 0.05) compared with the unimpaired patients (▦) in the frontostriatal ROIs, but not in the posterior association cortices. Control subjects (□) show activation that is broadly similar to the unimpaired patient subgroup. The mean fMRI signal (parameter estimates) reflects the mean of the ROI contrast values. Error bars represent SEM.

