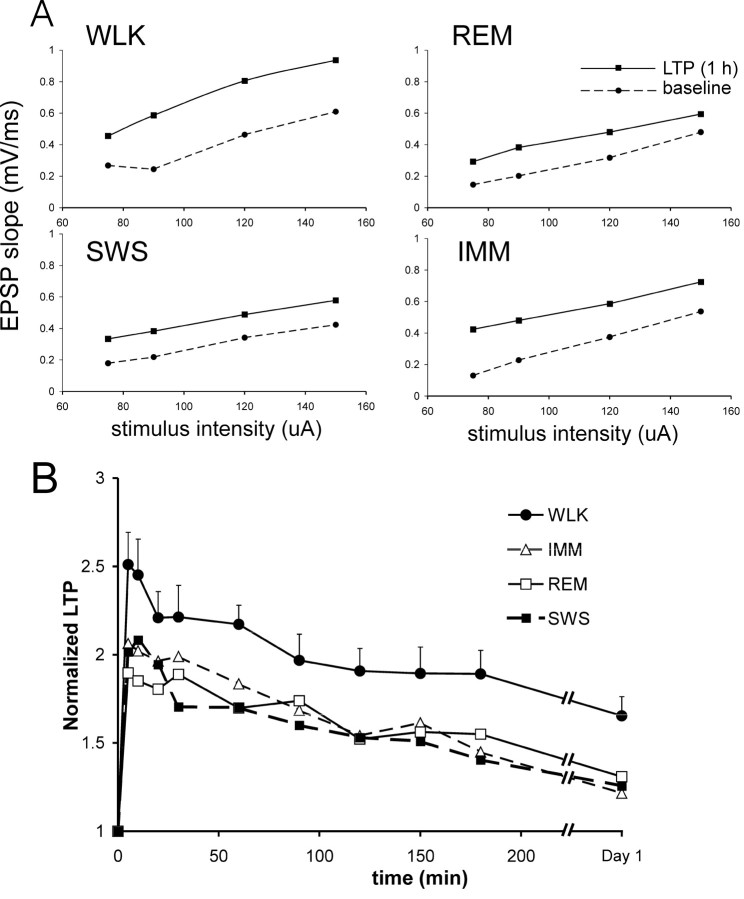
Figure 2.
Behavior-dependent basal-dendritic LTP is shown for different stimulus intensities (A) and a group of rats (B). A, Input-output curves show that LTP was found at various stimulus intensities of the test pulse, for experiments in which LTP was induced during one of the four behavioral states: WLK, REM, SWS, and IMM. Same experiments as shown in Figure 1 (rat 913). The rising slope of the fEPSP (for a 2 msec interval starting at latency 3.4 msec) was plotted as a function of stimulus intensity for the baseline (before tetanus) and at 1 hr after tetanus. B, LTP as a function of time averaged for a group of seven rats whose responses were stable across experiments, and the tetanus was given, in a pseudorandom order, in all four behavioral states. Baseline slope of the fEPSP was normalized to one in each rat. For clarity, the error bars (SEM) are only shown for LTP induced during walking. The magnitude of the SEM is generally similar for LTP induced during other behavioral states.

