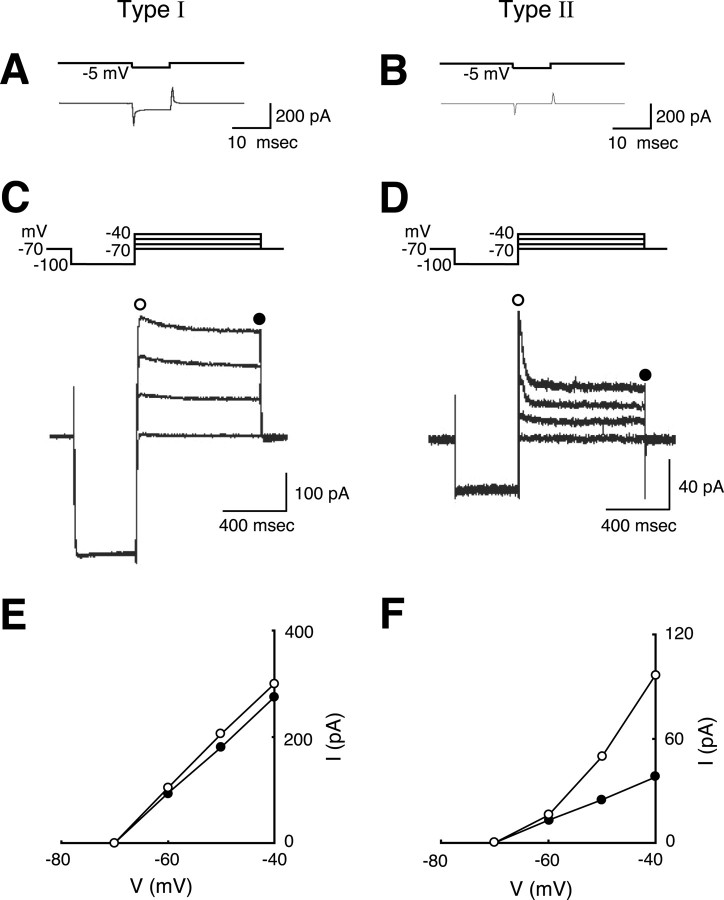
Figure 5.
Electroresponsiveness of type I (lower IR) and type II (higher IR) GFP-positive cells in the DG. A, C, E, Results from type I cells; B, D, F, results from type II cells. A, B, Measurement of IR with a -5 mV square voltage pulse (above) from a holding potential around -70 mV. The steady-state current at the end of the hyperpolarizing command pulse was measured. Current traces (below) are averages of the responses to 100 consecutive pulses. C, D, Responses to a voltage step pulse indicated at the top of the panel. Four current traces are superimposed for each panel. Note that the vertical scales are different between C and D. E, F, Plot of the transmembrane current (ordinates) elicited by the voltage step pulses shown in C and D against the command voltage (abscissas). Open circles represent the values at the peak of the outward current (C, D); filled circles indicate the steady-state current values (C, D).

