
Figure 2.
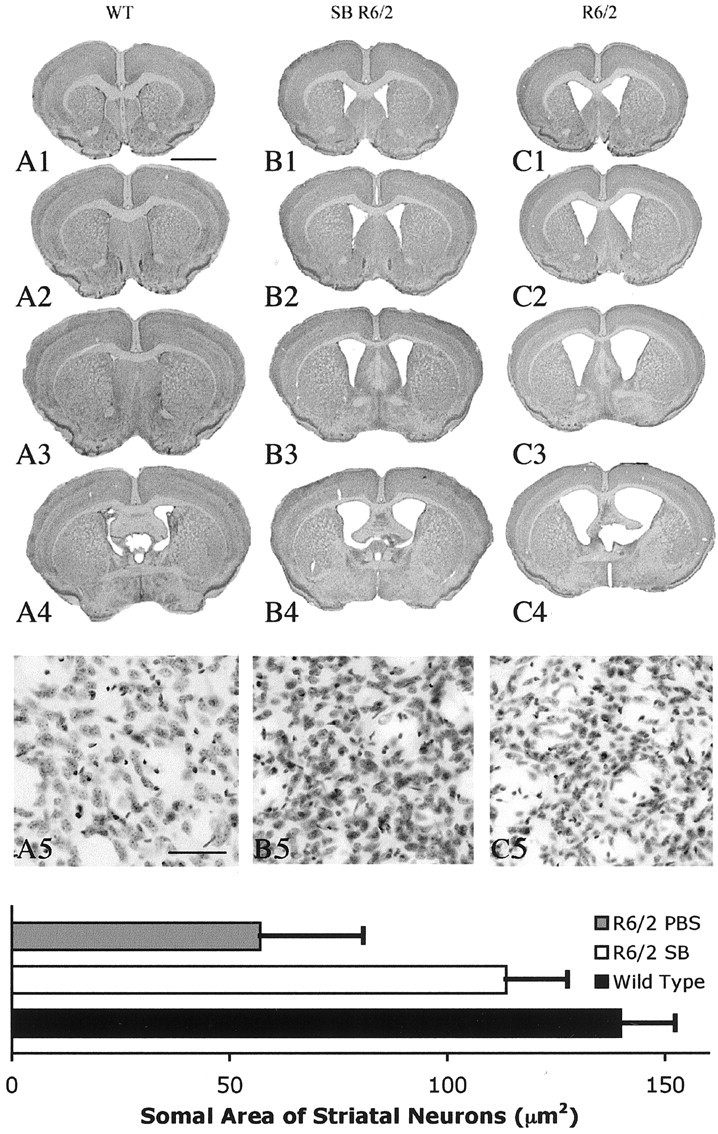
Gross brain and histopathological neuroprotection with sodium butyrate (SB) treatment. Photomicrographs of coronal serial step sections from the rostral neostriatum through the level of the anterior commissure in a wild-type littermate mouse (A1-A4), a sodium butyrate-treated (1.2 gm · kg-1 · d-1) R6/2 HD transgenic mouse (B1-B4), and a PBS-treated (C1-C4) R6/2 HD transgenic mouse at 90 d are shown. There was gross atrophy of the brain in the PBS-treated R6/2 mouse along with ventricular hypertrophy (C1-C4) compared with the wild-type littermate control mouse (A1-A4). In contrast, the sodium butyrate-treated R6/2 mouse brain (B1-B4) showed reduced gross brain atrophy and ventricular enlargement compared with the PBS-treated R6/2 mouse (C1-C4). Corresponding Nissl-stained tissue sections from the dorsomedial aspect of the neostriatum in a wild-type littermate control (A5), sodium butyrate-treated R6/2 mouse (B5), and PBS-treated R6/2 mouse (C5) are also shown. There was marked neuronal atrophy in the PBS-treated R6/2 mouse, with significantly less neuronal atrophy (p < 0.01) in the sodium butyrate-treated R6/2 mouse compared with this PBS-treated R6/2 mouse. The histogram shows means and SDs of somal areas of striatal neuronsquantitated in each group of mice (n = 10) (see Materials and Methods). Scale bars: A1-A4, B1-B4, C1-C4, 2 mm; A5, B5, C5, 100 μm.