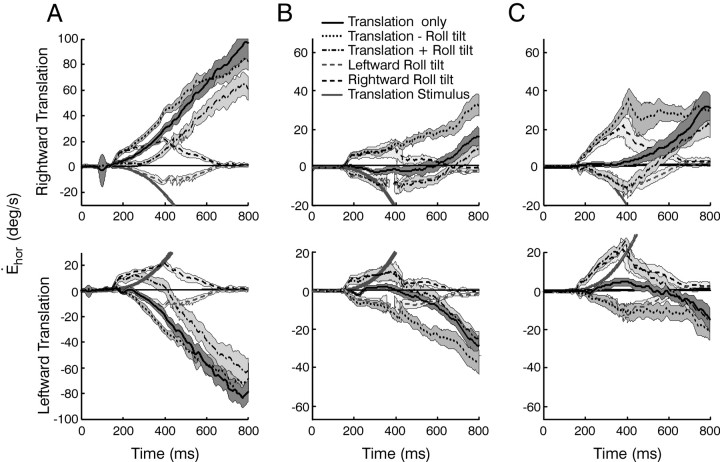
Figure 2.
Comparison of responses for different stimulus profiles. A-C, Mean ± SD horizontal eye velocities for a viewing distance of 20 cm in the three animals. Each column shows the responses of a different animal (i.e., animals A-C). Responses to rightward (top) and leftward (bottom) translations are superimposed on the bidirectional roll tilt stimuli (solid line, translation only; dash-dot line, translation + roll tilt; dotted line, translation - roll tilt; dashed gray line, leftward roll tilt; dashed black line rightward roll tilt). The solid gray lines illustrate the head velocity stimulus.

