Figure 5.

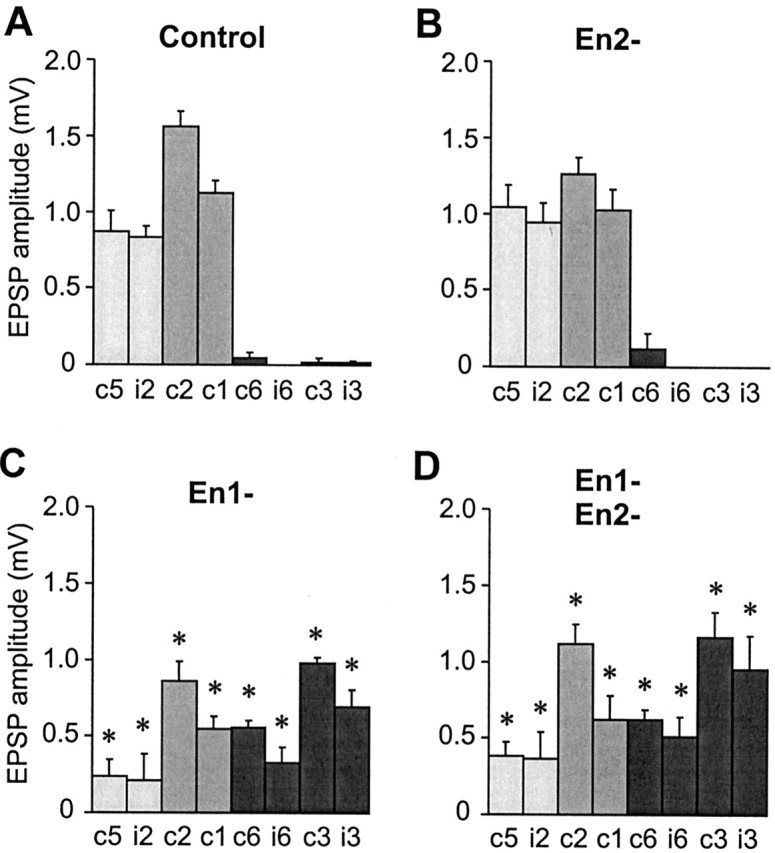
Quantification of the effects of En paralog knock-out on the synaptic connections of neuron 6m. A-D, Bar charts showing the mean amplitudes of monosynaptic unitary EPSPs recorded in eight GIs in response to stimulation of 6m: contralateral GI1 (c1), ipsilateral GI2 (i2), contralateral GI2 (c2), contralateral GI1(c1), contralateral GI6 (c6), ipsilateral Gi6 (i6), contralateral GI3 (c3), and ipsilateral GI3 (i3). Data for ipsilateral GIs 1 and 5 were not shown because they rarely receive synaptic inputs from 6m in control or experimental animals. Light gray bars indicate GIs that, in control animals, receive synaptic inputs from 6m only, medium gray indicates GIs that normally receive inputs both from 6m and from lateral neurons such as 6d (Marie et al., 2000), and dark gray indicates GIs that normally receive inputs only from 6d. Error bars indicate the SEM, and asterisks indicate a significant difference from the control value (p < 0.05). A, Synaptic connections of control 6m (from left to right, n = 13, 16, 15, 13, 16, 16, 16, 17). B, Synaptic connections of 6m after Pa-En2 knock-out (n = 5 for all). No significant differences from control are observed. C, Synaptic connections of 6m after Pa-En1 knock-out (n = 5 for all). There are significant differences from control, with decreases in the amplitude of connections to GI1, GI2, and GI5 and the appearance of de novo connections to GI3 and GI6. There are no significant differences compared with double knock-out. D, Synaptic connections of 6m after double Pa-En1 and Pa-En2 knock-out (n = 8, 8, 7, 6, 9, 8, 8, 8). There are significant differences from control, with decreases in the amplitude of connections to GI1, GI2, and GI5 and the appearance of de novo connections to GI3 and GI6.
