Figure 6.

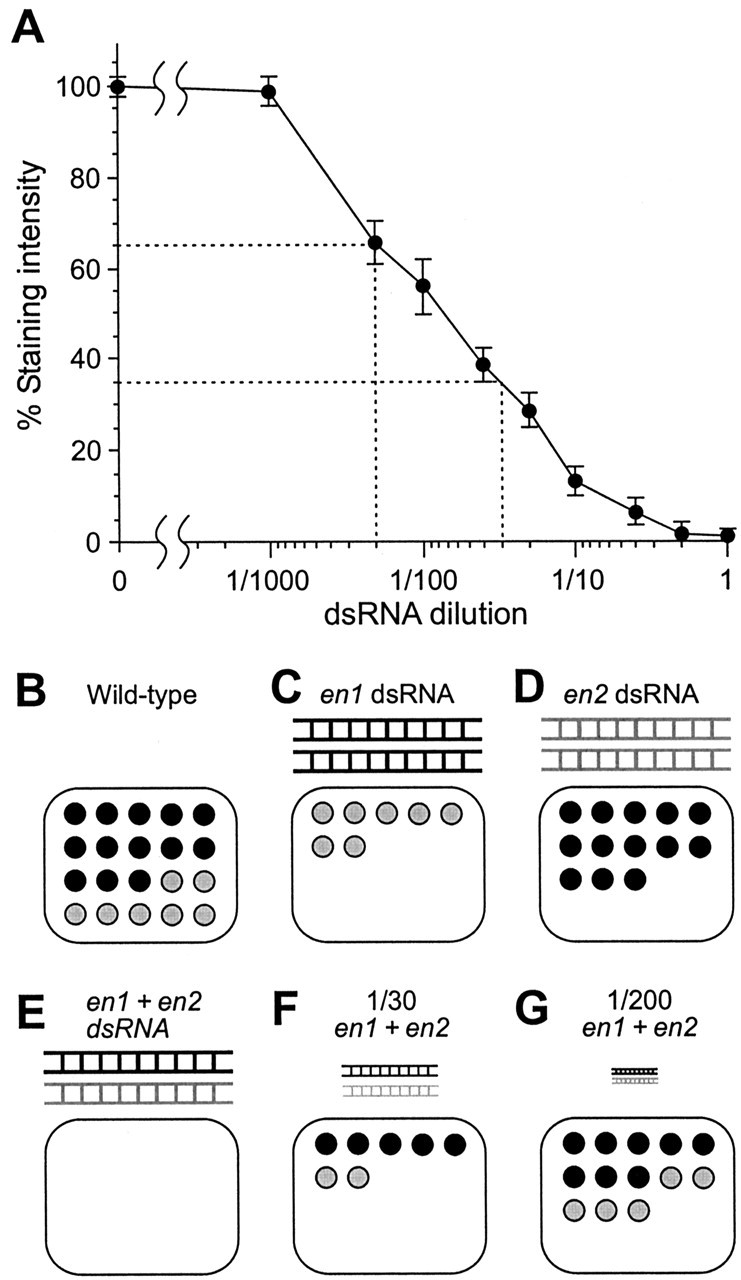
Effects of dsRNA dilution on En levels. A, Dose-response curve of percentage En staining intensity in neuron 6m, plotted against different dilutions of an equimolar mixture of both Pa-en1 and Pa-en2 dsRNAs. From left to right, n = 39, 3, 7, 7, 7, 4, 5, 6, 4, 14. The dashed lines indicate the dilutions of dsRNA required to reduce En staining to 65% of control (1:200) and to 35% of control (1:30). B-G, Diagrams illustrating the effects of different en dsRNAs and different dilutions on the amounts of En proteins. B, Wild-type nucleus, containing 65% Pa-En1 (black circles) and 35% Pa-En2 (gray). C, Application of Pa-en1 dsRNA (black) abolishes Pa-En1, leaving only Pa-En2. D, Application of Pa-en2 dsRNA (gray) abolishes Pa-En2, leaving only Pa-En1. E, Application of an equimolar mixture of the two dsRNAs abolishes all En activity in the nucleus. F, The 1:30 dilution of the dsRNA mixture knocks down total En activity to 35% of control levels, putatively equivalent to Pa-En1 knock-out. In this example, both Pa-En1 and Pa-En2 are reduced proportionately. G, The 1:200 dilution of the dsRNA mixture knocks down total En activity to 65% of control levels, putatively equivalent to Pa-En2 knock-out.
