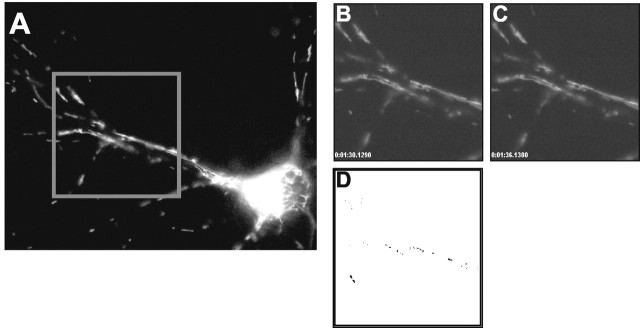
Figure 2.
Measuring mitochondrial movement between two frames (see Materials and Methods). A, Collected image field. A 255 × 255 pixel subregion is selected for analysis. Individual pixel fluorescence values from successive images (B, C) are subtracted. D, Threshold difference image. Dark pixels indicate “events” where change in pixel fluorescence exceeds a threshold value (20 fluorescence units). Pixel events for 20 successive images (2 min) were summated in each experiment.

