
Figure 7.
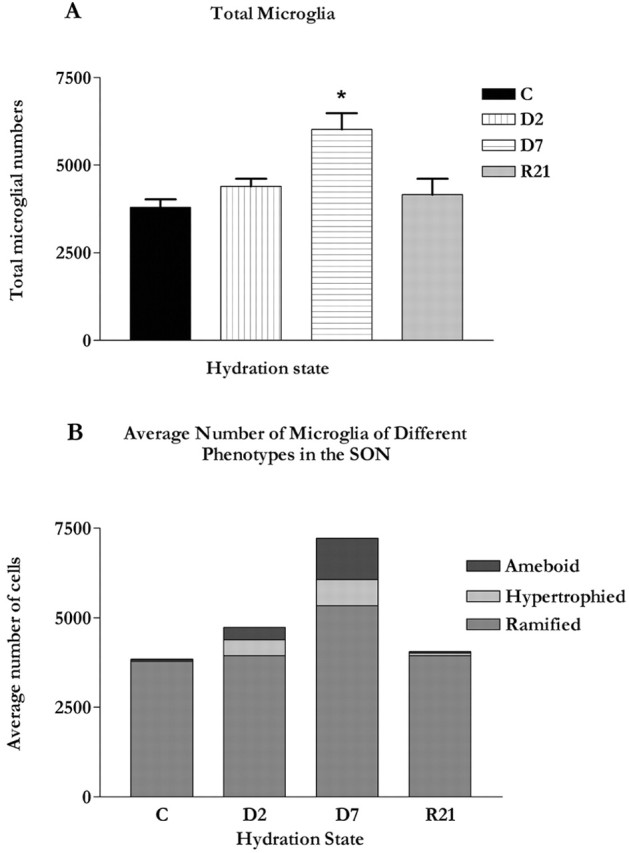
A, Graph showing the total numbers of microglia in the SON across hydration state. Significantly more microglia were observed in the SON at D7 (p < 0.01) relative to control and R21. Error bars indicate SEMs. B, Composite graph showing the relative numbers of each microglial phenotype in the SON across hydration states (graph generated using Microsoft Excel; Microsoft Corp., Seattle, WA).