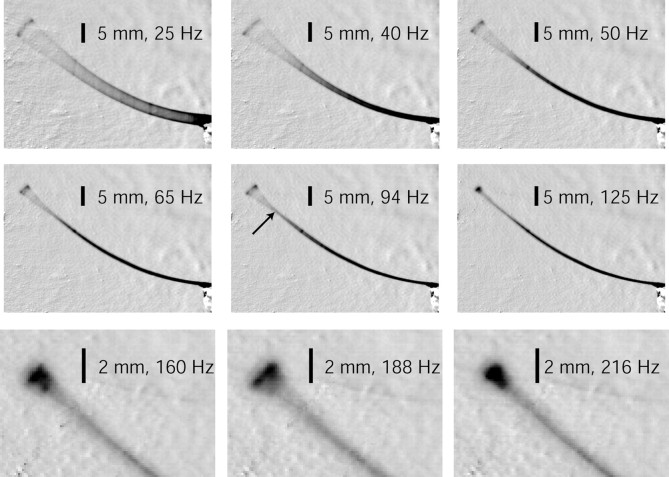
Figure 3.
First, second, and third resonant modes for whisker C1. The top row shows the first mode near 40 Hz and vibration at surrounding frequencies of 25 and 50 Hz. Note that, although the tip displacement does not appear much larger in the 40 Hz image than in the 25 Hz image, the base amplitude is much smaller in the 40 Hz image. The middle row shows the second mode at 94 Hz and the vibration at nearby frequencies of 65 and 125 Hz. Note the narrow neck (arrow) at resonance indicating the node of the second mode. The bottom row shows the third mode at 188 Hz and the vibration at the surrounding values of 160 and 216 Hz.

