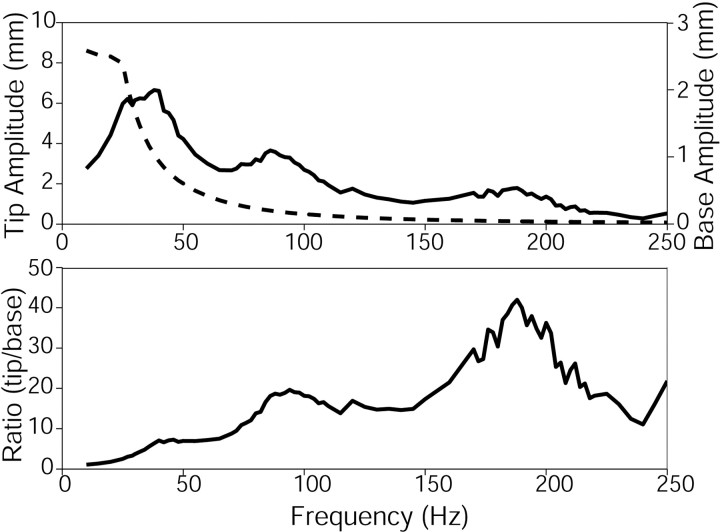
Figure 4.
Resonance curve for whisker C1. The top graph shows the absolute displacement of the tip (solid line) and the absolute displacement of the base (dashed line). The vertical scale on the left applies to the tip, whereas the vertical scale on the right applies to the base. The bottom plot shows the magnification ratio curve for the whisker, calculated by dividing the displacement of the tip by the displacement of the base. Resonance peaks are seen near 40, 94, and 188 Hz. All of the peaks are broad because of damping.

