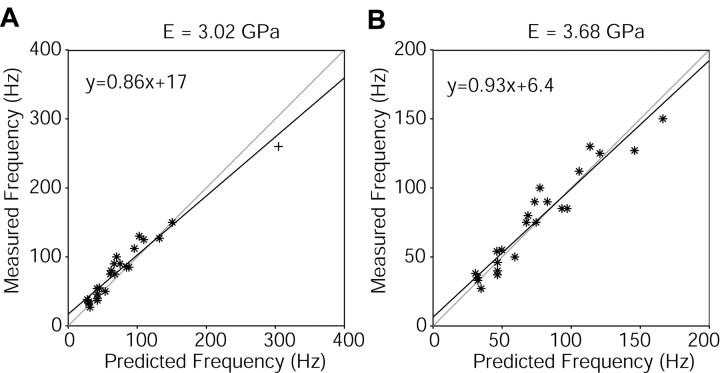
Figure 5.
Experimental versus theoretical values for first-mode resonant frequencies. A, The best fit between predicted and measured values for the first-mode resonant frequency for all of the whiskers was found for a value of Young's modulus equal to 3.02 GPa. The line y = x is shown in gray for comparison with the curve fit. An outlier at high frequency is indicated (+). B, Omitting the highest frequency from the plot in A yields an even better fit between predicted and measured values. In this case, the best fit was found for a value of E = 3.68 GPa. The line y = x is again shown in gray for comparison with the curve fit.

