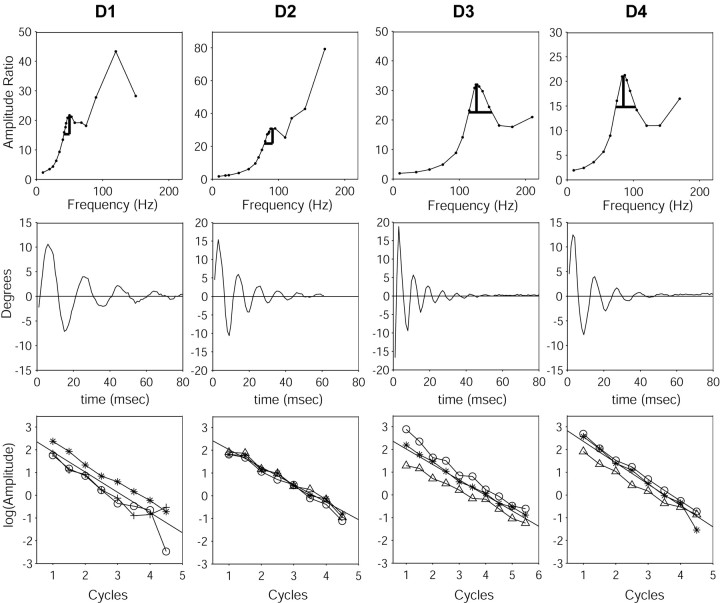
Figure 7.
Damping characteristics for the D row of whiskers. Each column represents results for a different whisker (D1, D2, D3, and D4). The top row presents the resonance curve for each whisker. Damping characteristics were calculated from the width of the resonance peaks, as indicated by the gray lines. The middle row presents the results of one impulse trial for each whisker. Note that all of the whiskers are strongly damped, undergoing at most five full cycles of oscillation. The bottom row presents three log decrement curves (obtained from three impulse trials) for each whisker. Each of the three trials is indicated by a different symbol (triangles, circles, asterisks). In each graph, the y-axis is the log of the amplitude of the peaks and troughs of the oscillation (shown in the second row), and the x-axis is cycle number. The slope of the lines on these graphs is the log decrement Δ.

