
Figure 6.
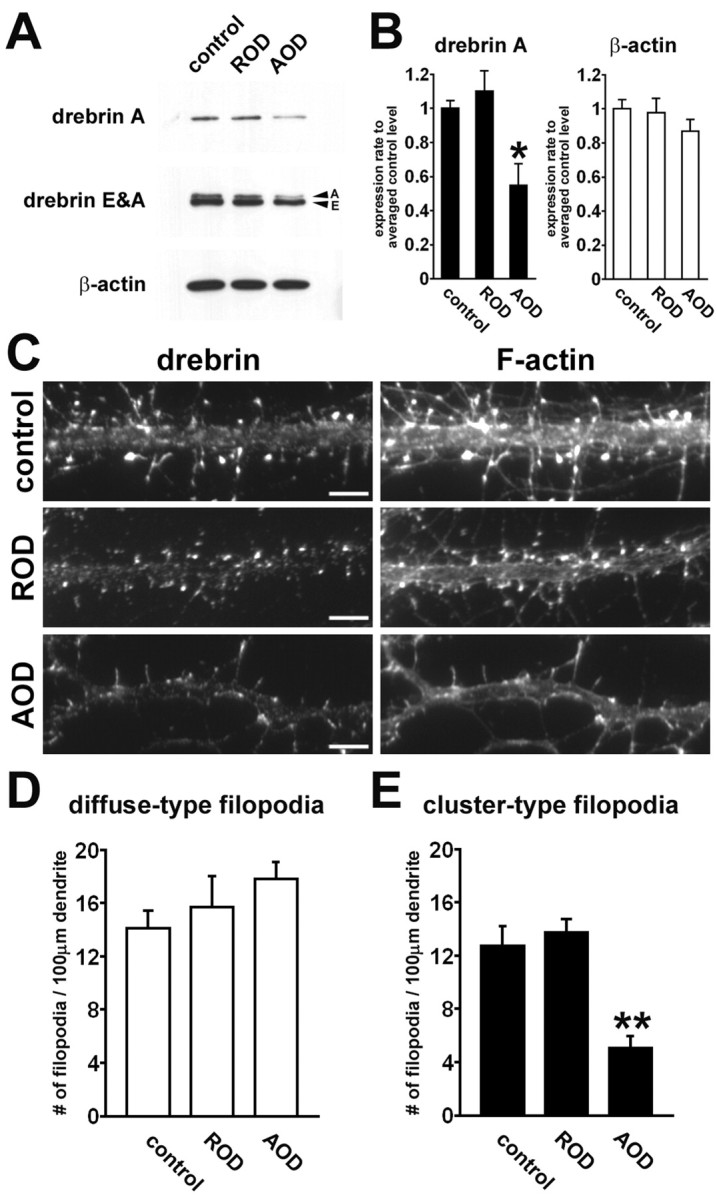
Changes of drebrin and F-actin distribution by antisense treatment. Cultured hippocampal neurons were treated with 10 μm AOD or ROD from 12 to 14 DIV. A, Western blots showing representative effect of AOD and ROD on expression of drebrin A, total drebrin (drebrin E and A), and β-actin. B, Densitometric analysis of the expression of drebrin A and β-actin. The AOD treatment significantly reduces drebrin A expression (n = 4 separate cultures; *p < 0.05, differences from control and ROD groups; Scheffé's F test). Neither AOD nor ROD has a significant effect on the expression of β-actin (n = 4 separate cultures; ANOVA; F = 1.00; p = 0.45). Error bars indicate SEM. Histograms show means + SEM. C, Double labeling of dendrites for drebrin (left) and F-actin (right) in control, ROD-treated, or AOD-treated neurons. The AOD treatment attenuates not only drebrin clustering but also F-actin clustering. Scale bars, 5 μm. D, E, Quantitative analysis of densities of diffuse-type (D) and cluster-type filopodia (E) in each group. The AOD treatment significantly reduces the density of cluster-type filopodia (n = 13, 10, 11 dendrites for control, ROD-treated, AOD-treated groups, respectively; **p < 0.001, differences from control and ROD groups; Scheffé's F test). Error bars indicate SEM. Histograms show means + SEM.