
Figure 6.
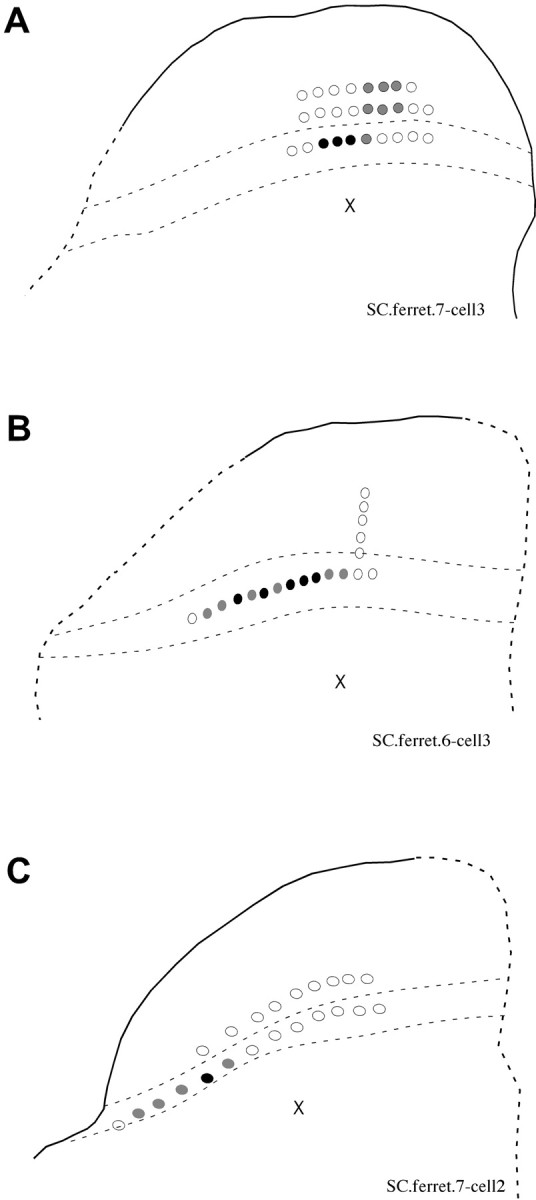
Functional topography of superficial- to deep-layer connections. The θ-stimulating electrode was moved systematically within the sSC to assess the presence of functional connections between the layers. Black crosses indicate the location of the recorded cells. Open circles indicate sites at which stimulation was applied but no response was evoked, and gray- and black-filled circles indicate locations from which polysynaptic and monosynaptic responses were elicited, respectively. The light dashed lines indicate the position of layer III, and the dark dashed lines indicate the borders of the SC. The size of the stimulating electrode and the stimulus intensity were the same for all of the sites. Data from three experiments are shown (A-C).