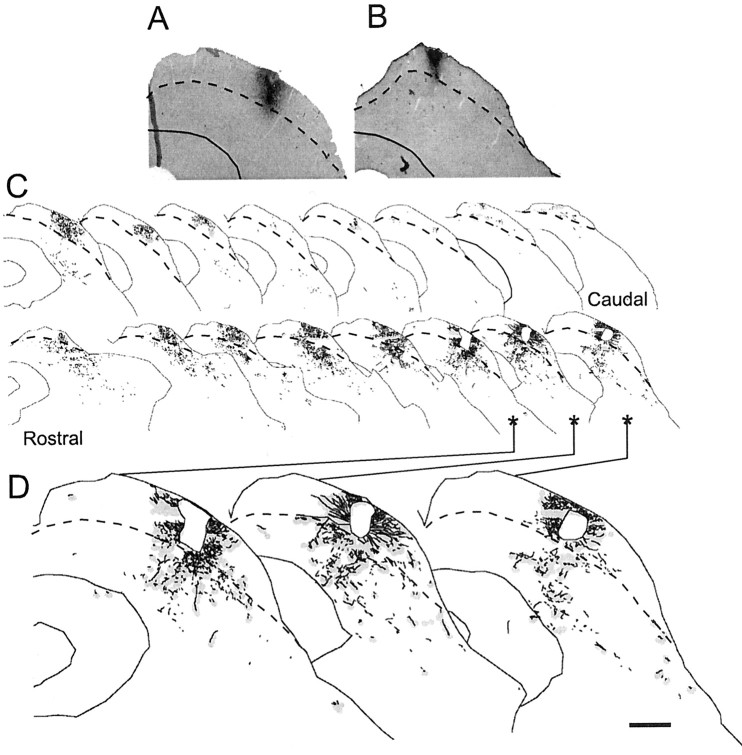
Figure 7.
Superficial- to deep-layer connections in adult ferrets. Distribution of biocytin-labeled axons and terminals after single injections into the sSC. A, B, Injection sites from two animals. C, Series of sections from one animal (injection site A) in which light gray shading depicts areas containing boutons, and black stippling indicates axons. Three section drawings (asterisks) are shown at higher power in D. The border between sSC and dSC is shown by the dashed lines. Scale bar: (in D) A-C, 200 μm; D, 100 μm.

