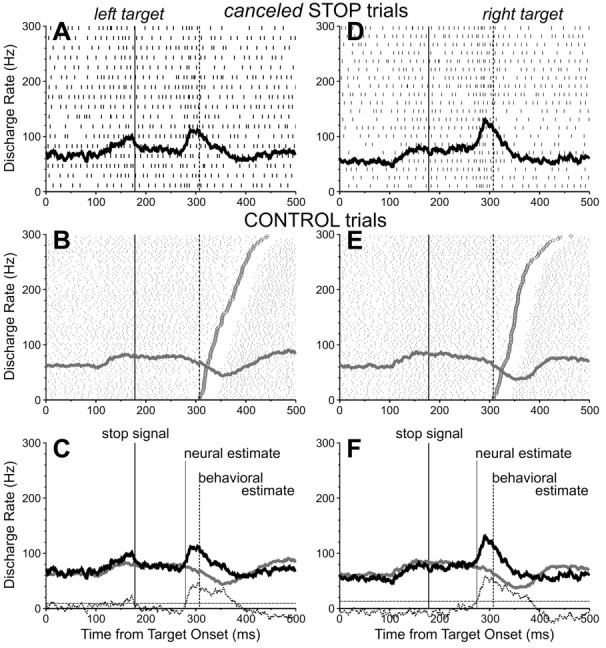
Figure 7.

Activity of one SC fixation-related neuron recorded during the countermanding saccade task. Top, Activity during canceled STOP trials with a 175 msec stop-signal delay and with the target presented 10° left (A-C) and 10° right (D-F) of the fixation point. Middle, Activity during corresponding CONTROL trials. Bottom, Superimposed spike density functions for matching CONTROL (gray) and STOP (black) trials. See Figure 3 legend for details.
