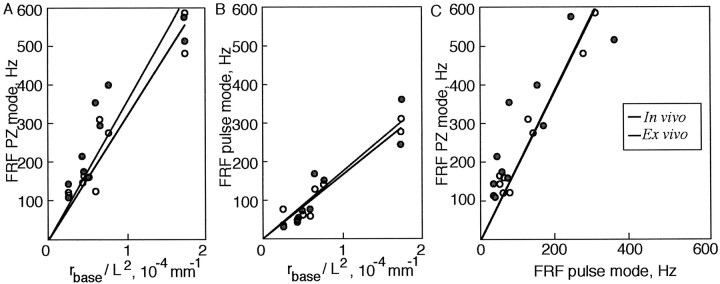
Figure 5.
Vibrissa FRF scales linearly as a function of its radius and length in PZ and pulse mode, in vivo and ex vivo. A, Plot of the FRFs measured in PZ mode from 10 C-row vibrissae in vivo (black circumference lines, open circles) and ex vivo (gray circumference lines, closed circles) versus the ratio of rbase/L2, as measured for the same vibrissae. Circles, Experimental values. Lines, Least-square fit. In vivo, C = 3.2 × 10 6 Hz · mm; R2 = 0.96. Ex vivo, C = 3.5 × 10 6 Hz · mm; R2 = 0.93. B, Plot of the FRFs measured in pulse mode from the same 10 vibrissae versus the ratio of rbase /L2. In vivo, C = 1.7 × 10 6 Hz · mm; R2 = 0.97. Ex vivo, C = 1.7 × 10 6 Hz · mm; R2 = 0.94. C, Plot of the FRFs measured in PZ mode from 10 vibrissae versus FRFs measured in pulse mode (data from parts A and B combined). In vivo, C = 1.9, R2 = 0.98. Ex vivo, C = 1.9; R2 = 0.87.

