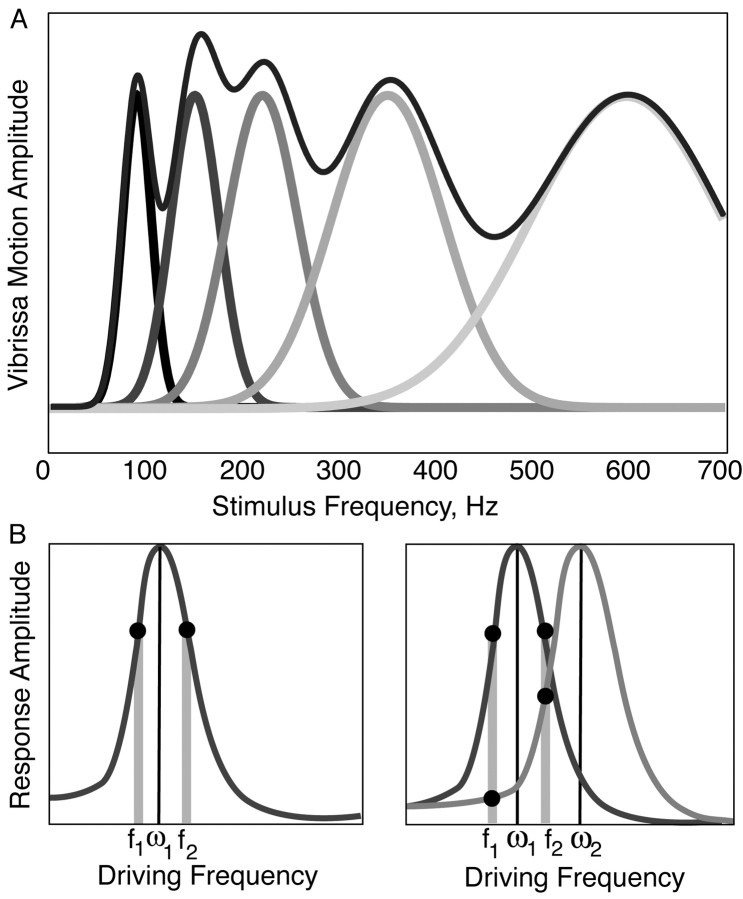
Figure 8.
Models of vibrissae resonance in detection and discrimination. A, An idealized diagram of the spectra of vibrissae within a single row. As an ensemble, vibrissae should amplify all of the high-frequency stimuli from 50 to 700 Hz. As such, they may improve the detection of small-amplitude, high-frequency stimuli that otherwise would not drive sufficient vibrissa motion to recruit significant changes in neural activity. B, A diagram of the response of a single versus a pair of vibrissae with overlapping frequency spectra to two sinusoidal stimuli. The two stimuli are presented at frequencies f1 and f2, which are equidistant from the FRF (ω1) of vibrissa 1. The two stimuli will evoke similar responses in vibrissa 1. However, when compared across two vibrissae, the two stimuli will evoke different responses. Relatively greater neural activity should be evoked in the neural representation of both vibrissae when presented with the higher frequency (f2), whereas relatively greater neural activity should be evoked in the neural representation of vibrissae 1 in response to the lower frequency input (f1). The prediction from this schema that multiple vibrissae within the same row are required for high-frequency discrimination is well met in the psychophysical literature (Carvell and Simons, 1990) and supported by neural recordings in the periphery and barrel cortex of the vibrissae-to-barrel pathways (Andermann et al., 2002; Andermann, Neimark, and Moore, et al., unpublished observations). Gray bars mark the input frequencies f1 and f2, and filled circles indicate the evoked response amplitude for each vibrissa at these frequencies. Thin black vertical lines indicate the FRF.

