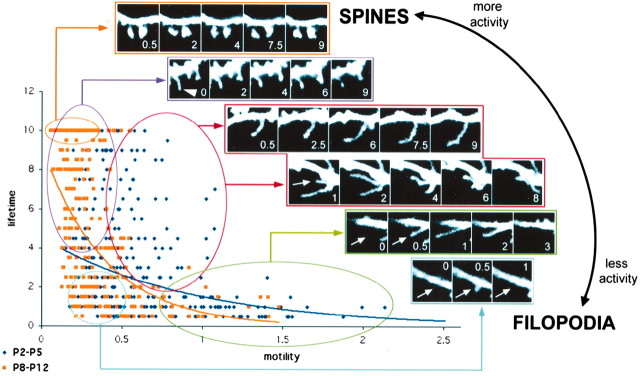
Figure 11.
A continuum of dendritic shaft protrusions throughout early postnatal development. This graph plots motility on the x-axis against lifetime on the y-axis for a total of 342 individual shaft protrusions at P2-P5 (dark blue) and 333 individual shaft protrusions at P8-P12 (light orange). The plot again demonstrates that at younger ages shaft protrusions are indeed more motile and have shorter lifetimes than at older ages, as was shown in Figure 5. The distribution of protrusions at either age is best fit by an exponential curve, but the characteristics of the distributions are different. At younger ages, as protrusion motility varies lifetime changes very little. The opposite is true at older ages when, as protrusions shift toward less motility, their lifetime increases considerably (and vice versa). On the basis of this distribution, a continuum of dendritic shaft protrusions can be discerned from the rapidly motile and transient filopodia (bottom right) to the relatively immobile and permanent dendritic spines (top left). We have arbitrarily defined several clusters of filopodia along this continuum. The insets show representative examples of imaged protrusions falling into several arbitrary categories of filopodia along this continuum, as well as an example of dendritic spines at P12. We speculate that neuronal activity regulates early dendritic protrusions such that, as neuronal activity increases throughout development, protrusions change along this continuum from filopodia to spine-like protrusions. Indeed, in more mature dendrites, some filopodia developed heads at their tips, thus resembling dendritic spines (arrowhead). Arrows indicate the position along the dendrite in which filopodia will appear in the next frame. Scale bar, 3 μm. Time stamps in white indicate minutes within a 10-min time-lapse movie.

