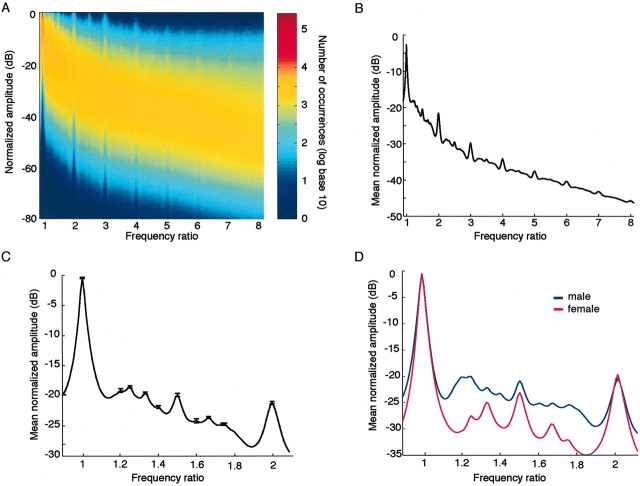
Figure 2.
Statistical characteristics of spoken American English based on an analysis of the spectra extracted from the >100,000 segments (200 per speaker) in the TIMIT corpus. Mean normalized amplitude is plotted as a function of normalized frequency, the maxima indicating the normalized frequencies at which power tends to be concentrated. A, The normalized probability distribution of amplitude-frequency combinations for the frequency ratio range 1-8. B, Mean normalized amplitude plotted as a function of normalized frequency over the same range. C, Blowup of the plot in B for the octave interval bounded by the frequency ratios 1 and 2. Error bars show the 95% confidence interval of the mean at each local maximum. D, The plot in C shown separately for male (blue) and female (red) speakers.

