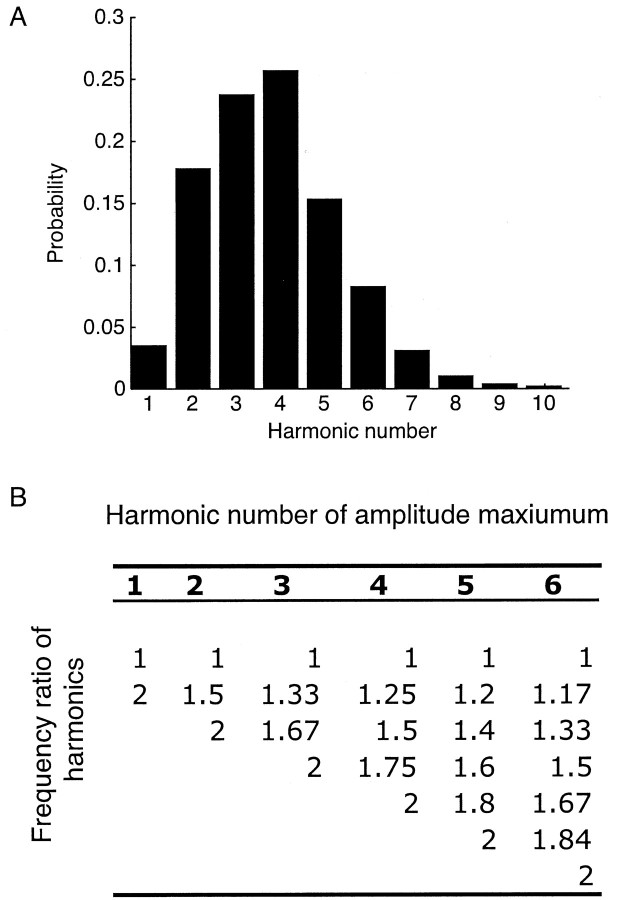
Figure 3.
Probability distribution of the harmonic number at which the maximum amplitude occurs in speech sound spectra derived from the TIMIT corpus. A, The distribution for the first 10 harmonics of the fundamental frequency of each spectrum. More than 75% of the amplitude maxima occur at harmonic numbers 2-5. B, The frequency ratio values at which power concentrations are expected within the frequency ratio range 1-2 (Fig. 2C) when the maximum amplitude in the spectrum of a periodic signal occurs at different harmonic numbers. There are no peaks in Figure 2 at intervals corresponding to the reciprocals of integers >6, reflecting the paucity of amplitude maxima at harmonic numbers >6 (A). See Materials and Methods for further explanation.

