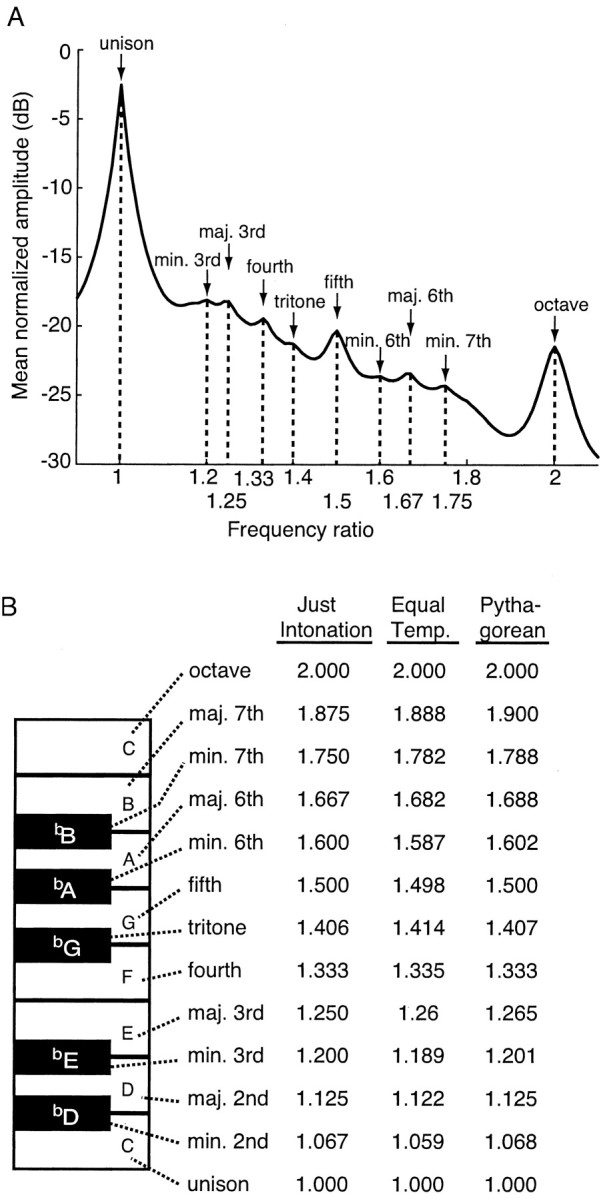
Figure 5.

Comparison of the normalized spectrum of human speech sounds and the intervals of the chromatic scale. A, The majority of the musical intervals of the chromatic scale (arrows) correspond to the mean amplitude peaks in the normalized spectrum of human speech sounds, shown here over a single octave (Fig. 2C). The names of the musical intervals and the frequency ratios corresponding to each peak are indicated. B, A portion of a piano keyboard indicating the chromatic scale tones over one octave, their names, and their frequency ratios with respect to the tonic in the three major tuning systems that have been used in Western music. The frequency ratios at the local maxima in A closely match the frequency ratios that define the chromatic scale intervals.
