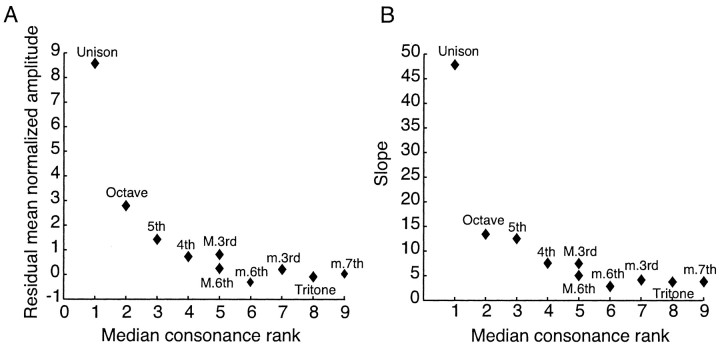
Figure 7.
Consonance rankings predicted from the normalized spectrum of speech sounds. A, Median consonance rank of musical intervals (from Fig. 6) plotted against the residual mean normalized amplitude at different frequency ratios. B, Median consonance rank plotted against the average slope of each local maximum. By either index, consonance rank decreases progressively as the relative concentration of power at the corresponding maxima in the normalized speech sound spectrum decreases.

