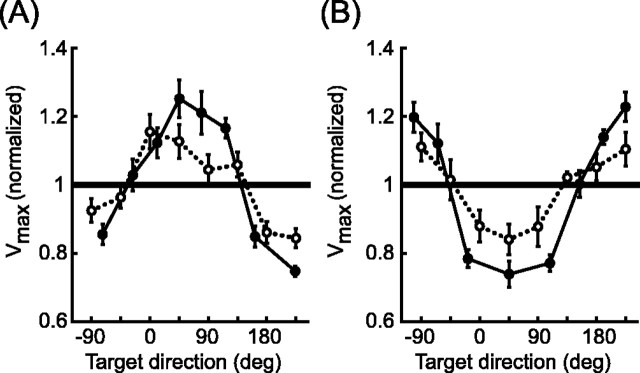
Figure 9.
Effects of visual shifts on reach velocity magnitude. Each line plots the mean peak tangential velocity (across subjects) for each target normalized to the mean peak tangential velocity in Center-Zero trials. Target directions are defined as the direction from the fingertip start position to the visual target. A, Left-Zero (solid line) and Center-Left (dotted line) trials. B, Right-Zero (solid line) and Center-Right (dotted line) trials. Error bars are ± 1 SE.

