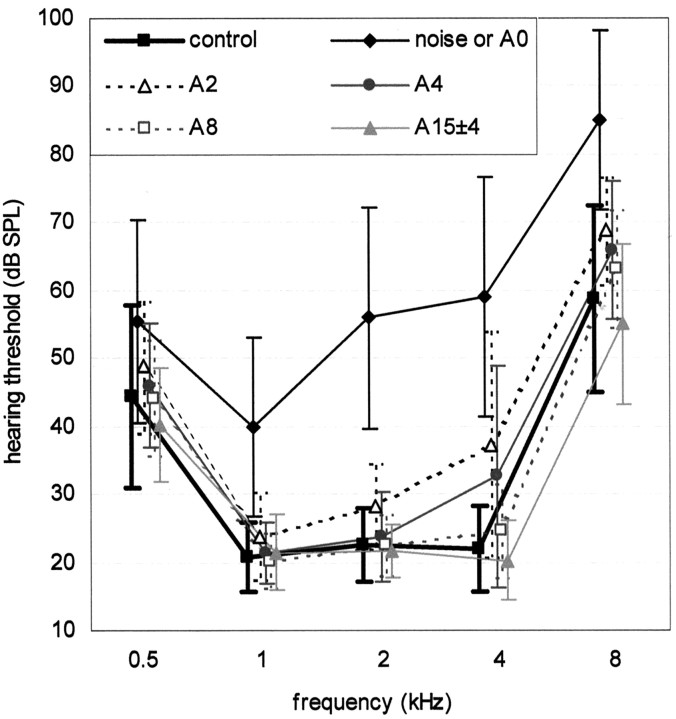
Figure 1.
Changes in hearing thresholds after release from noise. Hearing thresholds of Exp-birds (n = 14) to pure tones (0.5, 1, 2, 4, and 8 kHz) were measured behaviorally and compared with those in control birds (n = 9). Plotted (symbols and bars) are the means and SDs. Symbols are explained in the inset. A2, 2 d after release from noise. The speed of recovery was different for different frequencies: the mean threshold for 1 kHz was different from that of the controls on the day of release from the noise but no longer so 2 d after release, whereas the mean thresholds for 2 and 4 kHz took 4 d to become indistinguishable from those of the controls.

