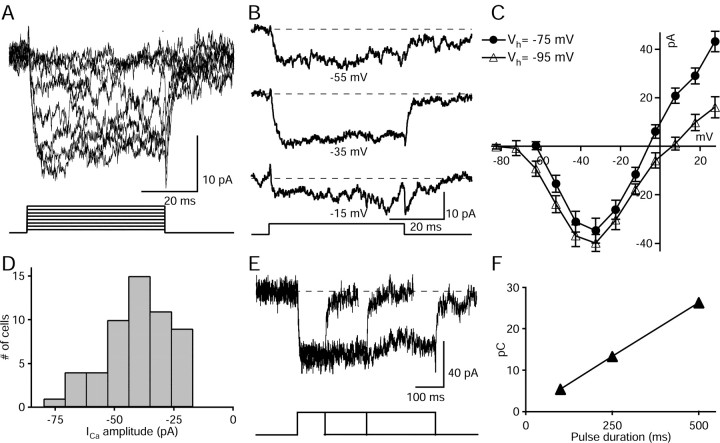
Figure 2.
Characterization of voltage-dependent calcium currents in AII amacrine cells. A, Voltage-activated currents recorded from an AII amacrine cell dialyzed with CsGlu. Depolarizing pulses of 10 mV steps were applied from a holding potential of -75 mV. B, Three individual traces from the currents shown in A from holding potential to test potentials -55, -35, and -15 mV from top to bottom, respectively. C, Average current-voltage relation measured from 14 cells recorded under similar conditions from Vhold = -75 and -95 mV. Values represent peak amplitude, and bars indicate SE. D, Amplitude histogram of the peak amplitude values (57 cells). E, Superimposed recordings from Vhold = -75 mV to Vtest = -35 mV for three different durations (100, 250, and 500 msec) showed a linear relation between charge transfer and pulse duration (F).

