
Figure 5.
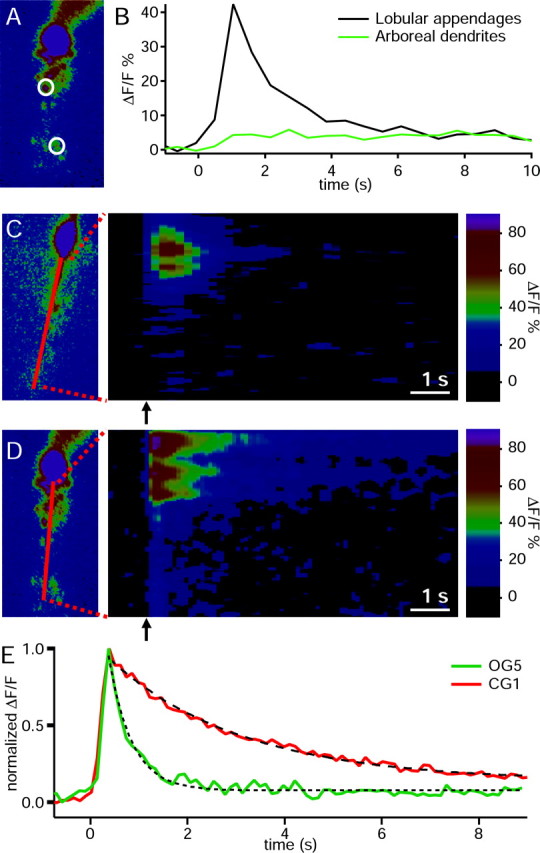
Localization of depolarization-induced Ca2+ signals. A, Fluorescence image of an AII amacrine cell filled via the patch pipette with OG5. The circles denote ROI, namely the lobular appendages in the middle region and arboreal dendrites in the lower region, for the calculation of ΔF/F0. B, Calcium transients of the AII cell shown in A, associated with a 500 msec depolarization. C, Offline linescan analysis of the spatial distribution of depolarization-elicited calcium transients. The left panel shows the fluorescence image of an AII cell, in which fluorescence intensity versus time was analyzed along the drawn line. The soma was excluded from the analysis. The right panel displays the percentage of change in fluorescence intensity (ΔF/F) values (color coded). The abscissa represents the time before and after depolarization (arrow). The ordinate represents the position within the dendritic arbor of the AII cell. The depolarizing pulse is indicated by the arrow. D, Offline linescan analysis as in C, using the high-affinity calcium indicator OG2. A depolarizing pulse was applied from Vhold = -85 mV to -45 mV for 250 msec. Images are pseudocolor representations of the raw fluorescence data, in which black to magenta indicates lowest to highest fluorescence. The depolarizing pulses are indicated at time 0 in all cases. E, Time course of calcium transients in response to a 250 msec depolarization monitored with OG5 and CG1. The traces are normalized to facilitate comparison of the decay kinetics.